Select menu: Stats | Repeated Measurements | Standard Curves with Correlated Errors
Use this to fit curves and nonlinear models to data, such as repeated measurements, where the residuals may follow an AR1 or a power-distance correlation model. The explanatory variate specifies the coordinates of the observations in the direction (e.g. time) along which the correlation model operates. You can also specify a factor to define groups of observations for the model – the correlation model is then defined only over the observations that belong to the same groups. You can specify your own models in command mode using the NLAR1 procedure.
- After you have imported your data, from the menu select
Stats | Repeated Measurements | Standard Curves with Correlated Errors. - Fill in the fields as required then click Run.
You can set additional Options then after running, you can save the results by clicking Save.
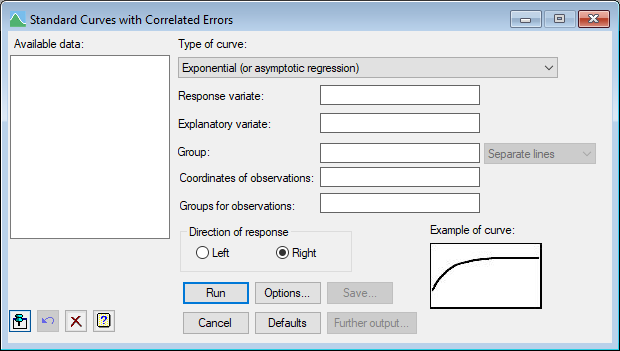
Available data
This lists data structures appropriate to the current input field. It lists either variates for specifying the response or explanatory variate, or a factor for specifying groups. The contents will change as you move from one field to the next. Double-click a name to copy it to the current input field or type the name.
Type of curve
This is used to select the type of curve to be fitted. There are five general classes of curve; each has several variations.
To help with the selection of an appropriate curve you can examine example plots of each type.
Response variate
Specifies the name of the variate containing the response (y) values.
Explanatory variate
Specifies the name of the variate containing the explanatory (x) values.
Group
For data classified into groups, different curves can be fitted to each group, possibly constrained by restricting some of the parameters to values common to all groups. The groups are specified using a factor. The correlation model is then defined only over the observations that belong to the same groups.
The type of model that is fitted can be selected from the adjacent list. The Common lines setting can be used to fit a single curve with common parameters over all the groups. The Parallel lines option extends the model to include a different constant parameter for each group, giving a set of parallel curves, one for each group. The Separate lines setting fits completely separate curves, in which all the parameters differ between groups.
Coordinates of observations
A variate specifying the coordinates of the observations in the direction (e.g. time) along which the correlation model operates.
Groups for observations
A factor to define groups of observations for the model – the correlation model is then defined only over the observations that
belong to the same groups.
Direction of response
For the exponential curves and Gompertz curve the direction of response can be selected. This determines whether the asymptote is to the left or right. For details on the effect of direction on the parameters of the curves see the exponential curves and growth
curves for the Gompertz curve.
Action buttons
| Run | Run the analysis. |
| Cancel | Close the dialog without further changes. |
| Options | Opens a dialog where additional options and settings can be specified for the analysis. |
| Defaults | Reset options to the default settings. Clicking the right mouse on this button produces a shortcut menu where you can choose to set the options using the currently stored defaults or the Genstat default settings. |
| Save | Opens a dialog where you can save results from the analysis. |
| Further output | Opens a dialog for specifying further output from the analysis and displaying residual and fitted model graphs. |
Action Icons
| Pin | Controls whether to keep the dialog open when you click Run. When the pin is down |
|
| Restore | Restore names into edit fields and default settings. | |
| Clear | Clear all fields and list boxes. | |
| Help | Open the Help topic for this dialog. |
See also
- Standard curves with correlated errors options
- Standard curves with correlated errors save options
- NLAR1 procedure for fitting nonlinear models with correlated errors
- FITCURVE directive for fitting standard nonlinear curves