Generates further output following a non-linear regression analysis.
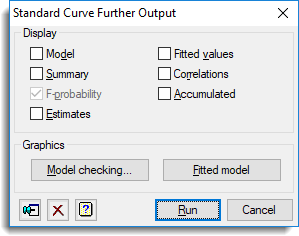
Display
| Model | Details of the model that is fitted |
| Summary | Summary analysis-of-variance |
| F-probabilities | F probabilities for variance ratios |
| Correlations | Correlations between the parameter estimates |
| Estimates | Estimates of the parameters in the model |
| Fitted values | Table containing the values of the response variate, the fitted values, standardized residuals and leverages |
| Accumulated | Analysis of variance table containing a line for each change in the fitted model |
Fitted model
You can draw a graph of the fitted model which shows the relationship of the response variate with one explanatory variate or one grouping factor or both. The fitted relationship is shown as one or more lines and the partial residuals are positioned with respect to the lines to represent the observed data.
Model checking
You can generate diagnostic plots for Model Checking.
See also
- Standard curves menu
- Standard curves options
- Standard Curves with Correlated Errors menu.
- Exponential Curves
- Fourier Curves
- Gaussian Curves
- Growth Curves
- Examples of Standard Nonlinear Curves
- Nonlinear Regression menu
- Nonlinear Quantile Regression menu
- Quantile Regression menu
- FITCURVE directive
- FITNONLINEAR directive
- FIT directive
- RQNONLINEAR procedure