Select the output to be generated initially in a non-linear regression analysis – the same information can also be displayed after the analysis, using the Further output dialog. You can also request that no constant term is included in the model: this will affect only the parameterization of factor effects, if there are factors in the model; but if not, it will constrain the regression to pass through the origin.
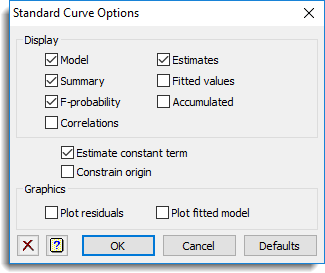
Display
| Model | Details of the model that is fitted |
| Summary | Summary analysis-of-variance |
| F-probabilities | F probabilities for variance ratios |
| Correlations | Correlations between the parameter estimates |
| Estimates | Estimates of the parameters in the model |
| Fitted values | Table containing the values of the response variate, the fitted values, standardized residuals and leverages |
| Accumulated | Analysis of variance table containing a line for each change in the fitted model |
Estimate constant term
Specifies whether to include a constant in the regression model. In simple linear regression this omits the intercept, in other words the fitted line is constrained to pass through the origin. In nonlinear regression (curve fitting) the constant term usually represents an asymptote, and omitting the constant fixes the asymptote at 0; to constrain the curve to pass through the origin you should refer to the next section.
Constrain origin
Constrains a nonlinear regression to pass through the origin, i.e. to have a response of 0 for zero in the explanatory variate. This can only be used with exponential and rational curves.
Graphics
Lets you generate default plots when you run a regression analysis. Plot residuals will produce diagnostic plots of the residuals, and Plot fitted model will generate a graph of the fitted model as a curve with the observed data as points.
See also
- FITCURVE in command mode for constraining the asymptote or origin to other values.
- Standard curves options
- Standard Curves with Correlated Errors menu.
- Exponential Curves
- Fourier Curves
- Gaussian Curves
- Growth Curves
- Examples of Standard Nonlinear Curves
- Nonlinear Regression menu
- Nonlinear Quantile Regression menu
- Quantile Regression menu
- FITNONLINEAR directive
- FIT directive
- RQNONLINEAR procedure