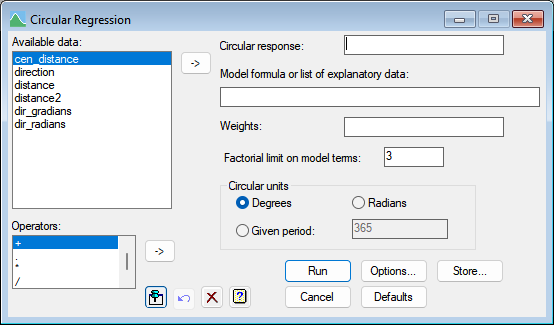
Select menu Stats | Regression Analysis | Circular Regression
Use this to perform circular regression, where the response variate is a periodic measure such as an angle, hour in the day, day in the year, which thus maps around a circle with values above the period mapping back to the range zero – period.
- After you have imported your data, from the menu select
Stats | Regression Analysis | Circular Regression. - Fill in the fields as required then click Run.
The circular regression menu uses the RCIRCULAR procedure which uses a von Mises distribution with an arctangent link function to map the real line to the circle. The model is similar in spirit to a generalized linear model, and it is assumed that the circular response follows a von Mises distribution with mean direction mu (μ) and concentration parameter kappa (κ). The mean direction μ is related to the linear predictor η by means of the link function μ = μ0 + 2 arctan(η). The linear predictor η is a linear combination of the explanatory terms. RCIRCULAR assumes the response variate is an angle in degrees, but the Circular units options allow you transform any periodic variate into the equivalent degrees. The model coefficients for the terms would need to be rescaled back to the original scale if the untransformed variate was to be used in the model equations.
Note that the model is not invariant to linear shifts of explanatory variates. This is because the linear predictor η does not contain a constant term. This can be a serious drawback of the circular regression model. See the RCIRCULAR help for more details.
Available data
This lists data structures appropriate to the current input field. The contents will change as you move from one field to the next. Double-click a name to copy it to the current input field or type the name. You can transfer multiple selections by holding the Ctrl key on your keyboard while selecting items, then click ![]() to move them all across in one action.
to move them all across in one action.
Circular response
Specify a circular response variate containing the data to be modelled. This is expected to be in degrees. If not, then it can be converted to degrees by using the Circular units settings.
Model formula or list of explanatory data
Specifies the model terms in the fitted model, which may be set using a model formula or using a list of terms separated by commas. You can transfer multiple selections from Available data by holding the Ctrl key on your keyboard while selecting items, then click ![]() to move them all across in one action.
to move them all across in one action.
Weights
A variate specifying the weights for each of the units in the regression. If the field is left blank then equal weights of 1 will be used.
Factorial limit on model terms
You can control the factorial limit on model terms to be generated when you use in model-formula operators like ‘*’.
Circular units
This gives the period of the circular response. The standard is for the circular response to be an angular measurement in degrees. If another option is selected, the response variate will be transformed to an equivalent angle in degrees. The coefficients would need to be back-transformed to their original scale if you need to express the model in terms of the original measurements.
| Degrees | The units are angles in degrees (0-360). Values outside this range will be mapped into the range. |
| Radians | The units are in radians (0 – 2π). The angle will be converted to degrees by multiplying by C(‘degrees’) = 180/π. |
| Given period | The units repeat after the given period (e.g. hours in a day = 24, days in a week = 7, days in a year = 365). The angle will be converted to the equivalent degrees by multiplying by 360/period. |
Operators
This provides a quick way of entering operators in the Model formula . Double-click on the required symbol to copy it to the current input field. You can also transfer operators by selecting one and then clicking the ![]() button to move it to the Model formula . You can also type in operators directly. See model formula for a description of each.
button to move it to the Model formula . You can also type in operators directly. See model formula for a description of each.
Action buttons
| Run | Run the analysis. |
| Cancel | Close the menu without further changes. |
| Options | Opens a dialog where additional options and settings can be specified for the analysis. |
| Defaults | Set the menu settings back to the default settings. Clicking the right mouse on this button produces a shortcut menu where you can choose to set the options using the currently stored defaults or the Genstat default settings. |
| Store | Opens a dialog where you can specify which results to store from the analysis. |
Action Icons
| Pin | Controls whether to keep the dialog open when you click Run. When the pin is down |
|
| Restore | Restore names into edit fields and default settings. | |
| Clear | Clear all fields and list boxes. | |
| Help | Open the Help topic for this dialog. |
- Circular Regression Options dialog.
- Circular Regression Store Options dialog.
- Linear Regression menu.
- Simple Linear Regression
- Simple Linear Regression (with Groups)
- Multiple Linear Regression.
- Multiple Linear Regression (with Groups).
- General Linear Regression.
- Polynomial Regression.
- Smoothing Spline.
- Locally Weighted Regression.
- Quantile Regression menu.
- Functional Linear Regression menu.
- RCIRCULAR procedure.
- MODEL directive.