Use this to specify additional options and settings to control the display of the a density plot of microarray data.
Graphics
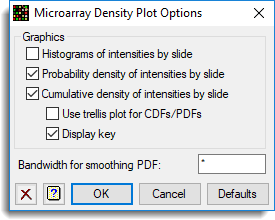
Specifies which graphical outputs are to be produced by the analysis.
| Histograms of intensity by slide | A trellis plot of the histograms of the data variate |
| Probability density of intensity by slide | A plot of the kernel density estimate of the data variate for each slide |
| Cumulative density of intensity by slide | A plot of the observed cumulative probability density of the data variate for each slide. |
| Use trellis plot for CDFs/PDFs | When selected, the PDF/CDF plots per slide will be plotted in with panel layout in a trellis plot, otherwise the plots from each slide will be overlaid on a common plot. |
| Display key | Controls whether to include a key on the graph indicating which CDF represents each slide when graphs are drawn a on single plot for the CDF (not a trellis plot) |
Bandwidth for smoothing PDF
The roughness/smoothness of the kernel density estimator can be changed by selecting a specified bandwidth. Increasing this value makes the plots smoother, and decreasing it makes it rougher, but more responsive to the data. The default value of * (missing) lets the menu select the bandwidth.
Action buttons
| OK | Save the options settings and close the dialog. |
| Cancel | Close the menu without making any changes. |
| Defaults | Reset the options to their default settings. |
Action Icons
| Clear | Clear all fields and list boxes. | |
| Help | Open the Help topic for this dialog. |
See also
- Density plot of microarray data
- Histograms, spatial plots and 2D plots for other ways of visualizing microarray data
- Microarray Menus
- DMADENSITY procedure
- TRELLIS procedure
- KERNELDENSITY procedure for setting bandwidths