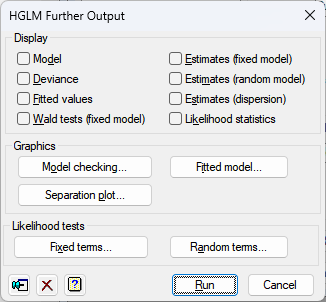
Use this to select output to display following a Hierarchical Generalized Linear Models (HGLM) analysis.

Display
This specifies which items of output are to displayed.
| Model | Details of the model that has been fitted |
| Deviance | Estimates of the deviances |
| Fitted values | Table with unit number, response variable, fitted values, residuals and leverages |
| Wald tests (fixed model) | Wald statistics for the terms in the fixed model |
| Estimates (fixed model) | Estimates of the parameters in the fixed model |
| Estimates (random model) | Estimates of the parameters in the random model |
| Estimates (dispersion) | Estimates of the parameters in the dispersion models (if any) |
| Likelihood statistics | Likelihood statistics for assessing the models |
Graphics
Following an HGLM analysis you can generate residual plots by clicking the Model checking button, a plot of the fitted model by clicking the Fitted model button, or a separation plot of the observed versus fitted probabilities by clicking on the Separation plot button.
LIkelihood tests
These buttons can be used perform likelhood tests of the Fixed terms and Random terms using the HGFTEST and HGRTEST procedures respectively, to assess the significance of the terms.
Action Icons
| Pin | Controls whether to keep the dialog open when you click Run. When the pin is up |
|
| Clear | Clear all fields and list boxes. | |
| Help | Open the Help topic for this dialog. |
See also
- HGLM menu for fitting HGLMs
- Hierarchical Generalized Linear Models Options dialog
- HGLM Model Checking for residual plots
- Fitted Model menu for plotting the fit of a HGLM
- HGLM Likelihood Tests for Fixed Terms dialog
- HGLM Likelihood Tests for Random Terms dialog
- Separation Plot menu
- HGDISPLAY procedure
- HGRTEST procedure
- HGFTEST procedure