Use this to to specify additional options and settings to control the display of the histograms of microarray data.
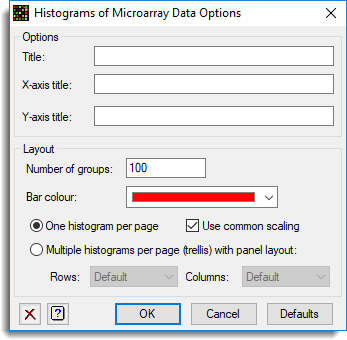
Title
The main title to appear at the top of the graph.
X axis title
The title for the X axis of the graph.
Y axis title
The title for the Y axis of the graph.
Layout
| Number of groups | The number of equally spaced bars that the data will be classified into. |
| Bar colour | A dropdown list of colours. Select the colour to be used to shade the bars in the histogram. |
There are two options on how the individual histograms for each slides are laid out on the page:
| One histogram per page | Each histogram will be plotted on its own page |
| Multiple histograms per page (trellis) with panel layout | The histograms of each slide will be separate panels on a single page (although new pages will be produced when the number of panels exceeds the Rows and Columns settings. |
Use common scaling
When plotting graphs on separate pages with the One Histogram per page option, use the same X and Y range on all axes.
Rows and Columns
When plotting histograms on single page with the Multiple histograms per page option, use a grid containing the specified number of rows and columns to hold the graphs.
Action buttons
| OK | Save the options settings and close the dialog. |
| Cancel | Close the dialog without making any changes. |
| Defaults | Reset the options to their default settings. |
Action Icons
| Clear | Clear all fields and list boxes. | |
| Help | Open the Help topic for this dialog. |
See also
- Histograms menu
- Density plots, spatial plots and 2D plots for visualizing microarray data
- MAHISTOGRAM procedure
- TRELLIS procedure for trellis plots using command language