Use this to set the options for the Nonlinear Quantile Regression menu.
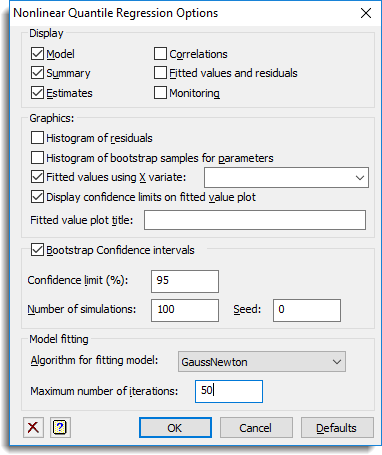
Display
The results to be displayed in the Output window:
| Model | The nonlinear regression model to be fitted. |
| Summary | A summary of the model fitting. |
| Estimates | Estimates of the parameters in the model. |
| Correlations | Correlations between the parameter estimates (only available if bootstrapping is used). |
| Fitted values and residuals | Table containing the values of the response variate, the fitted values and residuals from the regression. |
| Monitoring | Monitoring information at each iteration. |
Graphics
The graphical plots to be displayed:
| Histogram of residuals | Plot a histogram of the residuals from the quantile regression. |
| Histogram of bootstrap samples for parameters | Plot a histogram with confidence limits displayed of the bootstrap samples for each nonlinear and linear parameter in the model. |
| Fitted values using X variate | Plot the fitted values against the variate specified in the edit field. The dropdown list contains variates of the same length as the response variate and may be used to select a variate. If the edit field is left blank then the first variate used in the calculation of the terms will be used. |
| Display confidence limits on fitted value plot | Display confidence limits for the fitted values on the fitted value plot (only available if bootstrapping is used). |
| Fitted value plot title | The title to be used for the fitted value plot. |
Bootstrap confidence intervals
Use bootstrap resampling of the points in the model to estimate confidence intervals for the parameter estimates, fitted values and correlations of the parameters.
Confidence limit (%)
This gives the probability that the confidence interval covers the true value. This should be a value between 0 and 100 and if it is too close to 100 then it will not be well estimated unless the number of bootstraps is large.
Number of simulations
This gives the number of bootstrap simulations that will be performed to obtain confidence limits, standard errors and estimates of significance. Increasing this increases the time to perform the regression, but produces more precise estimates of the confidence limits etc.
Seed
This gives a seed to initialize the random number generation used for bootstrapping. Using zero initializes this from the computer’s clock, but specifying an nonzero value gives a repeatable analysis.
Algorithm for fitting model
The optimization algorithm to be used for fitting the nonlinear parameters:
| GaussNewton | The Gauss-Newton algorithm of the FITNONLINEAR directive. |
| NewtonRaphson | The Newton-Raphson algorithm of the FITNONLINEAR directive. |
| FletcherPowell | The Fletcher-Powell algorithm of the FITNONLINEAR directive. |
| Simplex | The simplex algorithm of the SIMPLEX procedure. |
The Simplex model can be slower to converge but in some cases converges more surely that the Gauss -Newton algorithm. The Simplex algorithm only requires bounds for each nonlinear parameter, but the other algorithms require an initial value. Some datasets will require a good estimate of the initial values of the parameters for convergence. If the parameters are not too highly correlated, and the objective function well behaved then the Gauss-Newton algorithm normally is the fastest algorithm.
Maximum number of iterations
The maximum number of iterations for the optimization algorithm. If the algorithm has not converged after this number of iterations then the model fitting will fail. Increasing this value may allow a model to converge, but often a better set of initial values, or a different step length will also help convergence.
Action buttons
| OK | Save the option settings and close the dialog. |
| Cancel | Close the dialog without making any changes. |
| Defaults | Reset the options to their default settings. |
Action Icons
| Clear | Clear all fields and list boxes. | |
| Help | Open the Help topic for this dialog. |
See also
- Nonlinear Quantile Regression menu
- Quantile Regression menu
- Nonlinear Quantile Regression Store Options
- Use Standard curve
- Nonlinear Models menu
- Standard Curves menu
- Standard Curves with Correlated Errors menu.
- RQNONLINEAR procedure
- FITNONLINEAR directive
- SIMPLEX procedure
- RQLINEAR procedure
- RQSMOOTH procedure
- FRQUANTILES directive
- RQOBJECTIVE function