
Use this to select the output to be generated initially by a one- or two-way analysis of variance – the same information can also be printed after the analysis, using the Further Output dialog.
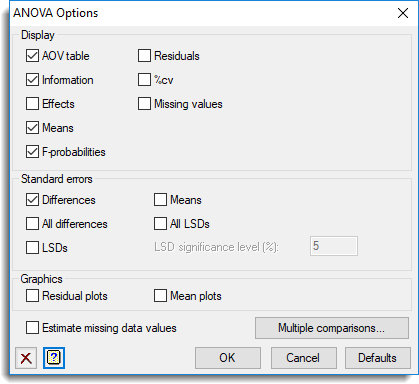
Display
Specifies which items of output are to be produced.
| AOV table | Analysis of variance table |
| F-probability | F-probabilities for the analysis of variance table |
| Information | Details of large residuals, non-orthogonality and any aliasing in the model |
| Effects | Tables of estimated treatment parameters |
| Means | Tables of means for treatment terms |
| Residuals | Tables of estimated residuals |
| %cv | Coefficients of variation and standard errors of individual units |
| Missing values | Estimates of missing values |
Standard errors
When printing tables of means you can specify the form in which standard errors will be displayed: as standard errors of the means, standard errors of differences of means (SEDs), or least-significant differences (LSDs). If required, you can print more than one type of standard error. You can specify the significance level for LSDs as a percentage (default 5) in the accompanying field. Note that LSDs cannot be formed for tables combining information over several strata. For an unbalanced design you can also display the standard errors for differences or LSDs between all pairs of means using the All differences and All LSDs options respectively.
Graphics
Lets you generate default plots when you produce an Analysis of Variance. Residual plots will produce diagnostic plots of the residuals. Mean plot will produce a graphical display illustrating main effect and interactions for the first two treatment factors. (A simpler plot will be output following one-way analysis of variance.)
Estimate missing data values
When selected, any units in the y-variate are estimated using analysis of variance. If this option is not selected then any units with missing values in the y-variate are excluded from the analysis and the data is analysed using regression.
Multiple comparisons
This opens the multiple comparisons dialog which lets you request output of multiple comparison tests and simultaneous confidence intervals.
This option is only available if the option Show multiple comparisons on menus has been enabled on the Tools | Options | Menus tab.
Action Icons
| Clear | Clear all fields and list boxes. | |
| Help | Open the Help topic for this dialog. |
See also
- One- and two-way analysis of variance menu.
- ANOVA Save Options dialog.
- Multiple comparisons dialog for specifying multiple comparisons.