Use this to select additional output and graphics following a one- or two-way analysis of variance.
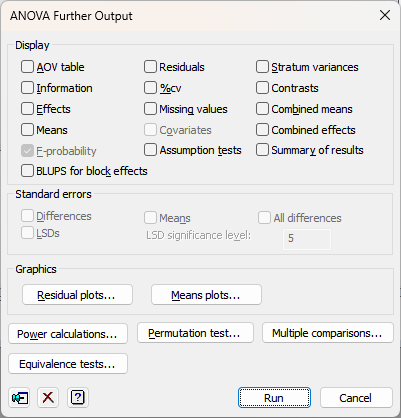
Display
Specifies which items of output are to be produced.
| AOV table | Analysis of variance table |
| Information | Details of large residuals, non-orthogonality and any aliasing in the model |
| Effects | Tables of estimated treatment parameters |
| Means | Tables of means for treatment terms |
| F-probability | F-probabilities for the analysis of variance table |
| Residuals | Tables of estimated residuals |
| %cv | Coefficients of variation and standard errors of individual units |
| Missing values | Estimates of missing values |
| Summary of results | A summary of the analysis that gives just the significant treatment effects in a format that would be useful for a report. This uses the A2RESULTSUMMARY procedure. |
| BLUPs for block effects | The best linear unbiased predictors (BLUPs) for block terms. These differ from the ordinary ANOVA residuals in that they are predictors rather than estimates of the block effects. The standard errors printed for these are controlled by the Differences, Means and All differences options in the Standard errors section. Note this will only be available for a balanced design with blocking. This uses the ABLUPS procedure. |
Standard errors
When printing tables of means you can specify the form in which standard errors will be displayed: as standard errors of the means, standard errors of differences of means (SEDs), or least-significant differences (LSDs). If required, more than one type of standard error can be printed. The significance level for LSDs can be specified as a percentage (default 5) in the accompanying field. Note that LSDs cannot be formed for tables combining information over several strata. For an unbalanced design you can also display the standard errors for differences or LSDs between all pairs of means using the All differences and All LSDs options respectively.
Graphics
Following an analysis of variance you can generate residual plots and plots of treatment means.
Power calculations
Lets you calculate the power for an Analysis of Variance.
Permutation test
Lets you perform random permutation tests for an Analysis of Variance. Random permutation tests provide an alternative to using the F-probabilities printed for variance ratios in an analysis of variance table in situations where the assumptions of the analysis are not satisfied.
Multiple comparisons
This opens the Multiple Comparisons dialog which lets you request output of multiple comparison tests and simultaneous confidence intervals.
This option is only available if the option Show multiple comparisons on menus has been enabled on the Tools | Options | Menus tab.
Action Icons
| Pin | Controls whether to keep the dialog open when you click Run. When the pin is up |
|
| Clear | Clear all fields and list boxes. | |
| Help | Open the Help topic for this dialog. |
Equivalence test
This button will open the ANOVA Equivalence Test dialog which lets you perform equivalence, non-inferiority and non-superiority tests between a control group and the other groups in the selected treatment term.
See also
- One- and two-way analysis of variance menu
- Multiple Comparisons dialog for specifying multiple comparisons
- Permutation Test menu performing random permutation tests
- ANOVA Save Options dialog
- ANOVA Equivalence Test
- ANOVA Equivalence Test Store Options
- Save ANOVA results in a spreadsheet
- A2RESULTSUMMARY procedure for a summary of the results