Use this to select the output to be generated by a stepwise discriminant analysis, and options used in the analysis.
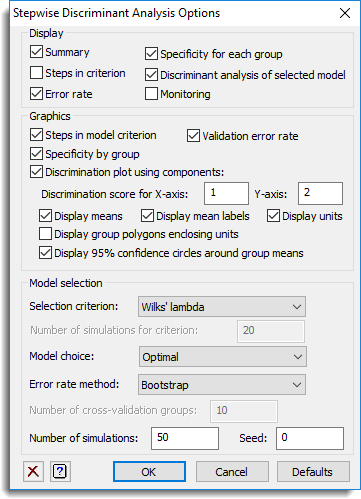
Display
Specifies which items of output are to be displayed in the Output window.
| Summary | Summary of the model fitted and options used. |
| Steps In criterion | The criterion value for adding each term at each step of selecting the model. The values in the table will be displayed as a + or – if that term has already been added to or dropped from the model. |
| Error rate | The validation error rate (proportion of the units that were incorrectly allocated) for the final model. |
| Specificity for each group | The specificity, proportion of the group that were correctly allocated, for each group for the final model. |
| Discriminant analysis of selected model | The output from the discriminant analysis for the final selected model. |
| Monitoring | The individual values of the criteria for each model tried . |
Graphics
Specifies which graphical outputs are to be produced by the analysis.
| Steps in model criterion | Draws a plot of the optimal criterion value at each step versus the number of terms in the model |
| Validation error rate | Draws a plot of the error rate (proportion of the units that were incorrectly allocated) estimated by the validation method (cross-validation, bootstrap, jackknife etc) at each step versus the number of terms in the model |
| Specificity by group | Draws a plot of the specificity (proportion of the group that were correctly allocated) at each step for each group versus the number of terms in the model |
| Discrimination plot | Draws a discrimination plot given by the X Root and Y Root boxes. You can specify to display the means, mean labels, unit scores, group polygons enclosing units and 95% confidence circles around the group means. |
Selection criterion
| Wilks’ Lambda | Uses the ratio of the determinant of the within-group sums of squares and products to the determinants of the total sums of squares and products |
| Cross-validation error rate | Uses the cross-validation error rate where one group of the data is left out at a time. The number of groups is specified below, and units are randomly allocated to groups. |
| Bootstrap error rate | Uses the bootstrap error rate where the observations are resampled and the omitted units are predicted. |
| Leave one out (jackknife) error rate | Uses the cross-validation error rate where one unit is left out at a time and predicted from the other units. |
Number of simulations for criterion
For the cross-validation or bootstrap criterion, this gives the number of times the resampling will be performed to generate the criterion. Increasing this will slow the analysis down.
Model choice
How the final number of variates selected for the model will be chosen.
| Number selected | Uses the model corresponding to the specified number of steps. |
| Optimal | Uses the model with the minimum validation error. |
Error rate method
| Raw prediction | Uses the error rate from the full training set. This will always be an under estimate for the true future error rate, as the model has been optimized for this data set |
| Cross-validation | Uses the cross-validation error rate where one group of the data is left out at a time. The number of groups is specified below, and units are randomly allocated to groups. |
| Bootstrap | Uses the bootstrap error rate where the observations are resampled and the omitted units are predicted. |
| Leave one out (jackknife) | Uses the cross-validation error rate where one unit is left out at a time and predicted from the other units. |
| None | Do not estimate the error rate. |
Number of cross-validation groups
For the cross-validation, this gives the number of groups the data will be allocated to. Each group is then left out of the analysis and predicted from the remaining groups. On each simulation the units are randomly assigned to groups.
Number of simulations
For the cross-validation or bootstrap validation error rates, this gives the number of times the resampling will be performed to estimate the error rate. Increasing this will slow the analysis down.
Seed
This gives a seed to initialize the random number generation used for bootstrapping and cross-validation. Using zero initializes this from the computer’s clock, but specifying an nonzero value gives a repeatable analysis.
See also
- Stepwise Discriminant Analysis
- Store Options for choosing which results to save
- Discriminant Analysis
- Canonical Variates Analysis
- SDISCRIMINATE procedure in command mode
- DISCRIMINATE procedure in command mode
- CVA directive in command mode