
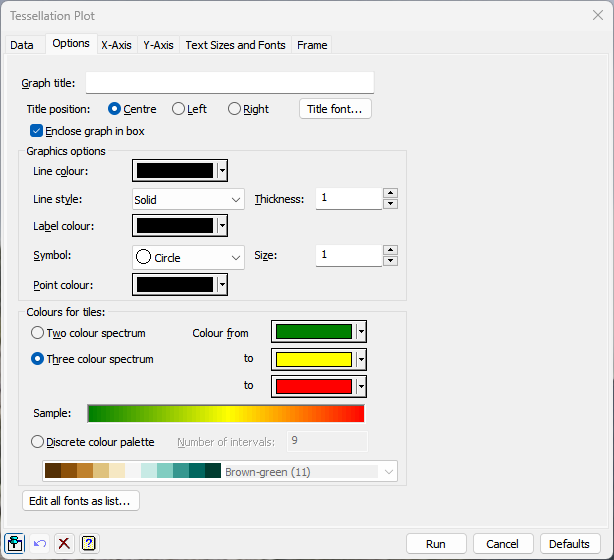
Use this to set attributes to control the appearance of a Tessellation plot.
Graph title
Lets you enter a title for the graph. The title appears at the top of the graph.
Title position
You can position the title by selecting the Centre, Left or Right option.
Enclose graph in box
Select this to draw an enclosing box around the graph.
Title font
This opens the Edit Font menu that lets you control the font for the title.
Graphics settings
These options allow the graphical attributes of lines, points and labels in the plot to be specified. For the lines used to plot the edges of the tiles in the tessellation or the triangles in the triangulation, you can give the Line colour, Line style and Thickness. For the points in the plot you can specify the Symbol and Size and Point colour. For the labels, you can specify the Label colour. Note the Size option controls the size of both the symbols and labels. The size and thickness values must between 0 and 10. You can change colours by clicking the colour buttons to get the pop-up colour selector to choose a new colour.
Colours for tiles
These options let you control the colours that are used when drawing the tiles in tessellation. You can use a Two colour spectrum, and the Spectrum from and to options let you specify the colours used to represent the minimum and maximum values. You can use a Three colour spectrum, and the Spectrum from and two to options let you specify the colours used to represent the minimum, middle and maximum values. You can change colours by clicking the colour buttons to get the pop-up colour selector to choose a new colour. An example of the changing spectrum is shown in the Sample field. The third colour choice is to use a Discrete colour palette. In this case, you can be select the palette from the drop-down list of colour palettes. You will also need to specify the Number of intervals needed from the palette (the minimum value for this is 3 and the maximum is 11). The colours will be interpolated from the colour palette using a piecewise interpolation using the number of intervals specified.
Edit all fonts as a list
Clicking this opens the Edit All Fonts as a List menu which allows all the fonts in the graph to be set in one place.
Action buttons
| Run | Produce the graph. |
| Cancel | Close the window without further changes. |
| Defaults | Reset the options to their default settings. |
See also
- Tessellation Plot data tab menu
- Y axis, X axis and Frame options
- Edit font dialog
- Text Sizes and Fonts options
- Edit All Fonts as a List
- Graphics Menu
- TRIANGULATION procedure