Select menu: Stats | Regression Analysis | Linear Functional Relationship
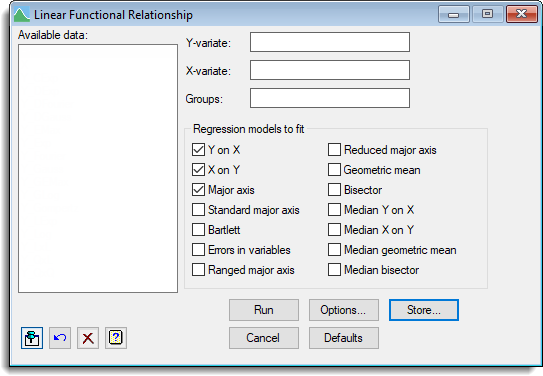
The Linear Functional Relationship dialog allows a variety of linear models to be fitted, selected from those listed in the Regression model to fit box. These include the usual linear regression models, functional regression models and quantile regression models.
- After you have imported your data, from the menu select
Stats | Regression Analysis | Linear Functional Relationship. - Fill in the fields as required then click Run.
You can set additional Options before running the analysis and store the results by clicking Store.
Functional relationships are used when the observations on both variables are subject to error variation. This contrasts with the situation in ordinary linear regression, where we assume that only the y-variate is subject to error (the x-variate is assumed to be observed exactly). If the variation in the x-values is not accounted for, the estimate of the slope will be biased towards zero.
Available data
This lists data structures appropriate to the current input field. The contents of this box will change as you move from one field to the next. You can double-click a name in the list box to copy it to the current input field.
Response variate
Specifies the name of the response (or Y-) variate.
Explanatory variate
Specifies the name of the explanatory (or X-) variate.
Groups
Specifies a factor defining the different groups. The probabilities of differences in slopes, elevations (assuming a common slope) and locations (assuming a common slope and intercept for each group) between groups can be calculated using settings in the Options dialog and these can be saved using the Store dialog.
Regression model to fit
One or more linear models can be fitted to the data. Select the boxes for each model to fit. The model options are:
| Y on X | Ordinary least squares with the dependent variable Y and independent variable X. |
| X on Y | Ordinary least squares but with the dependent variable X and independent variable Y. |
| Major axis | Major axis from a principal component analysis (this assumes that X and Y are equally variable). |
| Standard major axis | Takes the geometric mean of the ordinary regression slopes (Y on X and X on Y). This is the same as reduced major axis regression, except that a different parametric estimator is used for the confidence limits. |
| Bartlett | Bartlett’s three-group method. |
| Errors in variables | This fits a model that assumes the errors in Y and X are in proportion to the value specified by the VRATIO option. When VRATIO is one, this gives the same estimates as major axis (but not the same parametric confidence limits). |
| Ranged major axis | This scales the Y and X variables before fitting a major axis regression. |
| Reduced major axis | Estimates the slope as the geometric mean of the regression coefficients from regressions of Y on X and X on Y. |
| Geometric mean | The geometric mean of the ordinary regression slopes (Y on X and X on Y). This is the same the reduced major axis regression, except that a different parametric estimator is used for the confidence limits. |
| Bisector | Estimates the slope as the bisector of the ordinary regression slopes (Y on X and X on Y). |
| Median Y on X | Median (50% quantile) regression of Y on X. |
| Median X on Y | Median (50% quantile) regression of X on Y. |
| Median geometric mean | The geometric mean of the median regression slopes (Y on X and X on Y). |
| Median bisector | Estimates the slope as the bisector of the median regression slopes (Y on X and X on Y). |
Action buttons
| Run | Run the analysis. |
| Cancel | Close the dialog without further changes. |
| Options | Opens a dialog where additional options and settings can be specified for the analysis. lets you specify data structures in which to save fitted values, residuals, parameter estimates, standard errors, confidence limits and tests from the analysis. |
| Defaults | Reset options to the default settings. Clicking the right mouse on this button produces a pop-up menu where you can choose to set the options using the currently stored defaults or the Genstat default settings. |
| Store | Opens a dialog to specify names of structures to store the results from the analysis. The names to save the structures should be supplied before running the analysis. |
Action Icons
| Pin | Controls whether to keep the dialog open when you click Run. When the pin is down |
|
| Restore | Restore names into edit fields and default settings. | |
| Clear | Clear all fields and list boxes. | |
| Help | Open the Help topic for this dialog. |