Select menu: Spread | Column | Attributes/Format
Use this to change the name of a column or the way its values are displayed. Changes to column attributes only affect the selected column. If a column is read only this will be displayed on the dialog. You cannot change column protection here – instead refer to Column Protection.
- Select a column then from the menu select Spread | Column | Attributes/Format.
.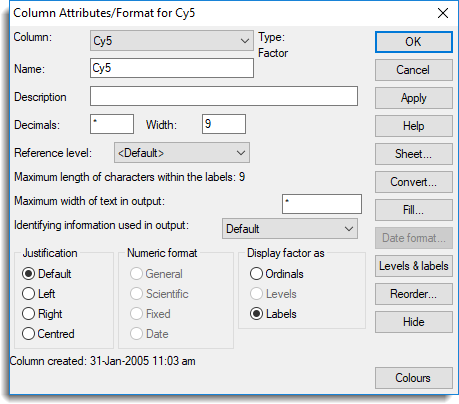
Column
Selects the column you wish to change attributes for.
Name
Specifies the name of the column. By editing this field you can change the name of the column, and thus the structure that the data will be saved to in Genstat.
Description
This sets additional text appended to the column name in output from some analyses. This has the same effect as the EXTRA parameter in command-mode declarations using VARIATE, FACTOR, TEXT etc.
Decimals
Specifies the number of decimal places for numeric columns in general, scientific or fixed-point format. The interpretation of decimals depends on the format chosen. For fixed format it is the number of decimal places and for general and scientific format it is the number of significant figures to be displayed.
Width
Specifies the width of the column as the number of ‘average characters’. This will be an exact number of characters for fixed-width fonts, but only approximate for proportionally spaced fonts.
Reference level
For a factor, a particular level is used in the parameterization of regression models as the base level. The effects of the other factor levels are then defined as differences from this base or reference level. This dropdown list of the factor’s current levels allows this to be set to a particular level. The option Default specifies the first level or the factor, and if the factor levels are reordered, the new first level will become the reference level. If a particular level has been chosen as a reference level, the spreadsheet will attempt to always make this the reference level on any operations that reorder the factor levels.
Display table headings as levels (only for a table)
Show the levels of the factor indexing columns in a 2+ dimensional table, rather than labels.
Calculation
The formula used to calculate a column. This can be edited and then may be re-run using the Recalculate Column dialog. This is only displayed if the column has been calculated.
Minimum
A number specifying the minimum value that the column will accept. If you try and enter a number smaller than this, a warning will be provided. You can still force the smaller number to be entered into the spreadsheet cell. A missing value (*) specifies no minimum value constraint. This is not displayed for factor columns.
Maximum
A number specifying the maximum value that the column will accept. If you try and enter a number larger than this, a warning will be provided. You can still force the larger number to be entered into the spreadsheet cell. A missing value (*) specifies no maximum value constraint. This is not displayed for factor columns.
Maximum length of characters within the labels
For a factor with labels, this gives the length of the longest label, and is just for information and cannot be edited.
Maximum width of text in output
For a text or factor, this limits the width of the strings printed in the Output window to the specified value. This can be used to make printed tables or columns more succinct.
Identifying information used in output
This controls the information that is used to identify data structures in output. For data structures that use a whole sheet (e.g. matrices or tables) this must be set on the first column of the spreadsheet containing the data (e.g. not classifying factors for a table or row labels for a matrix). This option has the same effect as using the the IPRINT setting for the data structures directives: VARIATE, TEXT, FACTOR, SCALAR, TABLE, MATRIX, SYMMETRICMATRIX and DIAGONALMATRIX.
The options that can be selected are:
| Default | Use the standard information for data structures for each type of output. For example, printing data structures in the output will use the column name, and running an analysis of variance will produce both the column name and description in the output (if description is set). |
| Identifier | Use the column name. |
| Extra | Use the extra text. You can provide extra text within the Description field. |
Data verified
An informational note to indicate data if this column has been verified through a double entry process. See Verify Data in Spreadsheet for more details.
Justification
Specifies whether values should be right or left justified or centred. Default justification is left for text and right for numeric data.
Numeric format
Specifies the format used for displaying numeric columns. General format prints numbers in the most compact format for a given number of significant figures, fixed format uses fixed-point notation, and scientific format prints numbers in scientific notation (e.g. 1.7665E+6 = 1.7665 x 10**6 = 1766500).
You can display numbers in a date format by clicking the Date format button. The default date format applied to a column is set using the Date Format tab on the Tools | Options | menu.
Display factor as
Controls how factors are displayed: using ordinals, levels, or labels. Factor values are stored as ordinals which are integers in the range 1,2,…,n, where n is the number of levels of the factor. Factors are displayed using the ordinal values unless levels or labels have been defined. Factor levels are a set of numbers, one for each ordinal level, used for display of the factor values. Factor labels are a set of strings, one for each ordinal level, used for display of the factor values.
Colour using factor
This item is only displayed if one or more factor columns has colours associated with its levels. The dropdown list lets you change a column’s background cell colour using the colours associated with a factor column. The colours associated with a factor’s levels are set with the Edit Factor Levels and Labels dialog.
Action Buttons
| OK | Apply the changes and close the dialog. |
| Apply | Apply the changes leaving the dialog open. |
| Cancel | Close the dialog without further changes. |
| Sheet | Opens the Properties dialog allowing you to edit some of the spreadsheet properties. |
| Convert | Change the type of a column or spreadsheet using the Convert dialog. |
| Fill | Insert values in a column using the Column Fill dialog. |
| Date Format | Change the date format and base date used to display a column’s values when the numerical format type Date is selected. This uses the Date Formats dialog. |
| Levels & labels | Edit factor levels, labels and colours all in one place with the Edit Factor Levels and Labels dialog. |
| Reorder | Change the order that the factor levels/labels are displayed in using the reorder factor levels dialog. |
| Hide/Show | Hide or show the column as when using the Hide/Show Columns in a Spreadsheet dialog. |
| Recalculate | Recalculate the column (if it has a column calculation) as when using the Recalculate Column dialog. |
| Colours | Open the Column Colours dialog to modify the column’s text and background colours from the default colours. |
See also
- Edit Multiple Column Attributes
- Edit Factor Levels and Labels
- Converting columns to other types.
- Column Protection
- Edit Menu Commands (Spreadsheet)
- Spreadsheet Calculate Menu
- Options – Date Format
- Spreadsheet Column Menu
- Spreadsheet Properties
- Hide/Show Columns in a Spreadsheet
- Recalculate Column
- Column Colours