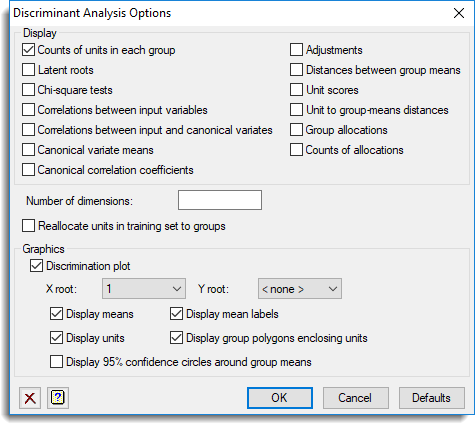
Use this to select the output to be generated by a linear discriminant analysis.

Display
Specifies which items of output are to be displayed in the Output window.
| Counts of units in each group | Numbers of units in each group with a complete set of observations |
| Latent roots | The canonical variate loadings, the latent roots and the trace |
| Chi-square tests | Chi-square tests for significance of roots |
| Correlations between input variables | The within-group correlation matrix of the input variates |
| Correlations between input and canonical variates | The within-group correlations between the input and canonical variates |
| Canonical variate means | Canonical variate scores for the group means |
| Canonical correlation coefficients | Canonical correlation coefficients |
| Adjustments | The adjustments required to the canonical variate scores to centre the results about the origin |
| Distance between group means | The inter-group distances |
| Unit scores | Canonical variate scores for the units |
| Unit to group mean distances | Mahalanobis squared distances between the units and the group means |
| Group allocations | The initial grouping and the allocation of units to groups |
| Counts of allocations | Counts of allocations |
Number of dimensions
Specifies how many latent roots and vectors are printed (and saved); the residuals are formed from the remaining dimensions.
Reallocate units in training set to groups
Controls whether the units in the training set are to be reallocated to groups. If this is not selected then their group values, either displayed or saved, will be missing.
Graphics
Specifies which graphical outputs are to be produced by the analysis.
| Discrimination plot | Draws a discrimination plot given by the X Root and Y Root boxes. The maximum dimension that can be displayed is that given above. You can specify to display the means, mean labels, unit scores, group polygons enclosing units and 95% confidence circles around the group means. A 1 dimensional plot can be produced by specifying the X root and setting the Y root to |
See also
- Discriminant Analysis menu
- Linear Discriminant Analysis Store Options for choosing which results to save
- Quadratic Discriminant Analysis Options for choosing settings and which results to display for a quadratic discriminant analysis
- Quadratic Discriminant Analysis Store Options for choosing which results to save for a quadratic discriminant analysis
- DISCRIMINATE procedure in command mode