Use this to select the output to be generated by a quadratic discriminant analysis, and options used in the analysis.
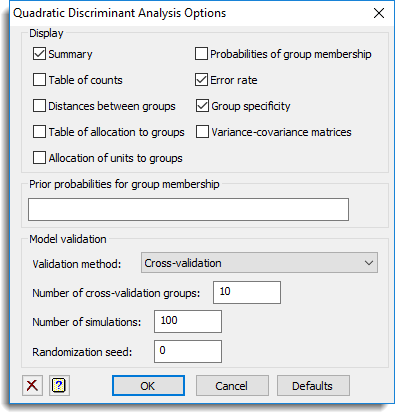
Display
Specifies which items of output are to be displayed in the Output window.
| Summary | Summary of the model fitted and options used . |
| Table of counts | Table of counts of training units in each group . |
| Distances between groups | Generalized pairwise distance between group means. |
| Table of allocations to groups | Table of counts of training units allocated to each group. |
| Allocation of units to groups | The group each unit was allocated to . |
| Probabilities of group membership | The posterior probability of being allocated to each group. |
| Error rate | The validation error rate (proportion of the units that were incorrectly allocated). |
| Group specificity | The specificity, proportion of the group that were allocated to each group. |
| Variance-covariance matrices | Variance-covariance matrices for each group . |
Prior probabilities for group membership
This specifies the prior probabilities for group membership for the analysis. The prior probability for a group gives the chance that an unknown individual picked from the population at random will belong to that group. The default is to have equal probability of belonging to each group. The larger the prior probability is for a group, the more likely that an individual will be allocated to that group, so equal priors does not bias the allocation towards any group. The prior probabilities should sum to one, and there should be one for each group. This can be a structure name of a variate containing the prior probabilities, or a list of numbers separated by commas or spaces.
Validation method
| Cross-validation | Uses the cross-validation error rate where one group of the data is left out at a time. The number of groups is specified below, and units are randomly allocated to groups. |
| Bootstrap | Uses the bootstrap error rate where the observations are resampled and the omitted units are predicted. |
| Leave one out (jackknife) | Uses the cross-validation error rate where one unit is left out at a time and predicted from the other units. |
| Raw prediction | Uses the error rate from the full training set. This will always be an under estimate for the true future error rate, as the model has been optimized for this data set |
Number of cross-validation groups
For the cross-validation, this gives the number of groups the data will be allocated to. Each group is then left out of the analysis and predicted from the remaining groups. On each simulation the units are randomly assigned to groups.
Number of simulations
For the cross-validation or bootstrap validation error rates, this gives the number of times the resampling will be performed to estimate the error rate. Increasing this will slow the analysis down.
Randomization seed
This gives a seed to initialize the random number generation used for bootstrapping and cross-validation. Using zero initializes this from the computer’s clock, but specifying an nonzero value gives a repeatable analysis.
See also
- Discriminant Analysis menu
- Store for choosing which results to save
- Linear Discriminant Analysis Options for choosing settings and which results to display for a linear discriminant analysis
- Linear Discriminant Analysis Store Options for choosing which results to save for a linear discriminant analysis
- QDISCRIMINATE procedure in command mode