This is a brief introduction to the three main stages in analysing data with the Windows version of Genstat. These are: loading data, performing the required analysis, and saving the results. If you are already familiar with the Genstat command language you may like to refer to Using the Genstat Command Language. A more complete introduction to Genstat can be found in the online Guide to Genstat: Introduction (pdf). This can be found by selecting Help | Genstat Guides | Introduction to Genstat for Windows.
Entering Data
The easiest way to enter new data into Genstat is by using a spreadsheet.
- From the menu select Spread | New | Create.
This will open a dialog in which you can specify the size and type of the spreadsheet. - For the time being, the default settings can be used; click OK to continue.
A window containing a spreadsheet of the default size (100 rows and 10 columns) will appear, with a * in every cell. This is how Genstat represents a “missing value” (an unknown quantity). - To enter data in the spreadsheet click on the cell in row 1, column C1.
This will be highlighted in blue, indicating that it is the current cell. You can now type a value, and press ENTER to move on to the next cell (row 2, column C1). - Enter the following set of data in columns C1 and C2:
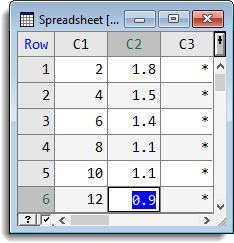
- After entering the value 12 you will need to click on row 1, column C2 to move to the second column.
- Once all the data has been entered select Spread | Delete | Empty Rows + Columns.
This will shrink the spreadsheet to the size of the data that you have entered. The spreadsheet should now appear as shown above.The data you have entered is displayed in the spreadsheet window but cannot be accessed by Genstat until it is saved as Genstat data. By default, this should happen automatically when you switch focus to any other window (by clicking outside the spreadsheet); you should see a number of messages appearing in the Output window to indicate this has occurred.
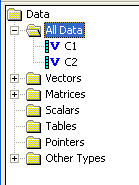
- If you click on the Data tab on the bottom-left then move up and double-click the All Data folder, you should obtain a listing of the variables C1 and C2 (see below).
If, for any reason, this automatic update does not appear to work (for example, it may have been disabled on the Tools | Spreadsheet Options Sheets tab) you can make the update manually. From the Spread menu select Update, then select Changed Data to Genstat. This will create Genstat data structures containing your data. Messages should now appear in the Output window showing that your data has been successfully loaded.
You can also update your data to Genstat, by clicking ![]() on the main toolbar.
on the main toolbar.
Statistical Analysis
The Stats item on the menu bar lists various forms of analysis that can be performed on your data. For example, you can fit a straight line to the data that you have just entered.
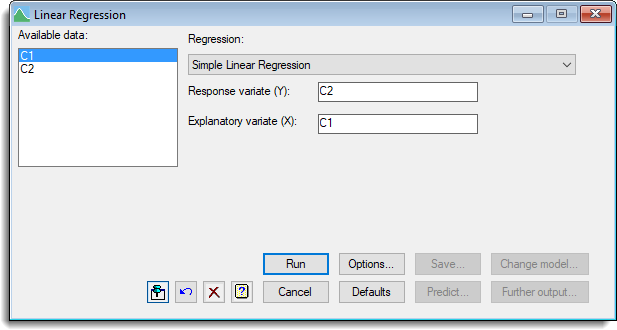
- From the menu select Stats | Regression Analysis | Linear Models. This will open the Linear Regression dialog that lets you specify your data and various other options controlling the analysis.
- Click in the field labelled Response Variate then double-click on C2 in the Available data field.
- Likewise, set the Explanatory Variate to C1.
- Now click Run. The following image shows the dialog with the data entered.
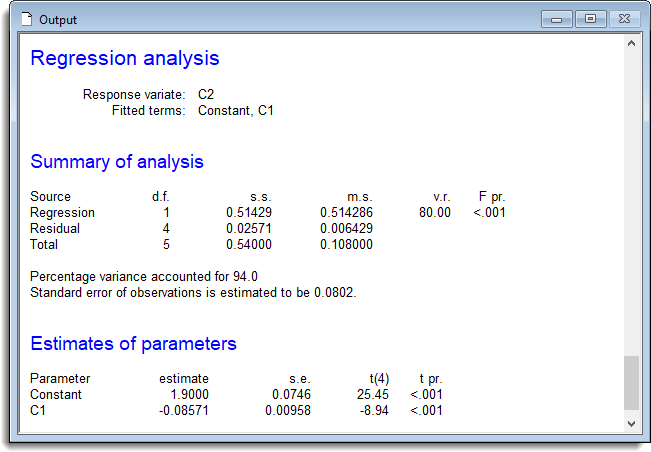
The results from the regression of C2 on C1 will appear in the Output window. You can use the scroll bar to move up and down in the window if it is not large enough to display all the output at once.
- Bring the Linear Regression dialog to the front again by clicking the Window tab at the bottom-left then move up and click the Linear Regression item.
You can use the Further Output button to produce more output from the analysis. For example, clicking the Fitted Model button will open the Genstat Graphics Viewer containing a graph of the data and fitted line.
Saving the Results
The results of the regression analysis are contained in the Output window.
- You can save this to a file by selecting File | Save As then specifying an appropriate name for the saved output.
Note that the File menu always operates on the currently active window, which is indicated by highlighting the title bar. Click on the title bar of the Output window to ensure it is the active window before using the File menu.