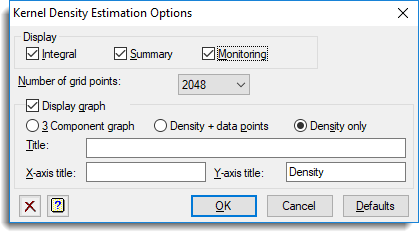
This dialog specifies options for the Kernel Density Estimation menu.
Display in output
The following options allow the output from the fitting of the kernel density estimate to be provided in the Output window.
| Integral | The integral of the kernel density estimate |
| Summary | A printed summary of the kernel density estimate |
| Monitoring | Monitoring of the iterative estimation of the bandwidth |
Number of grid points
How many points that the kernel density estimate is calculated on.
Display graph
This produces a graph of the kernel density estimate. There are two graphs that can be produced:
| 3 component graph | This is produced by the KERNELDENSITY procedure and shows 3 aspects of the data: the resulting kernel density estimate, a histogram of the data and the location of data points superimposed on the one graph. However you cannot provide the overall or axis titles for this graph |
| Density only | This produces a graph of just the kernel density estimate using saved values of the grid and kernel density estimates with the usual DGRAPH statements. With this option, you can provide your own overall and axis titles in the provided fields. |
Action buttons
| OK | Save the specified options and close the dialog. |
| Cancel | Close the dialog without making any changes to the options. |
| Defaults | Reset all options to their default values. |