Use this to fit a Response Surface to a y-variate using 2 or more predictors (x-variates). There are two models available, a quadratic surface using the RQUADRATIC procedure or a spline surface using the VSURFACE procedure. The spline model is only available for 2 x-variates and a normal distribution with an identity link. You can use a range of generalized linear models when using the quadratic model.
- After you have imported your data, from the menu select
Stats | Regression Analysis | Response Surface. - Fill in the fields as required then click Run.
Available data
This lists data structures appropriate to the current input field. The contents will change as you move from one field to the next. Double-click a name to copy it to the current input field or type the name.
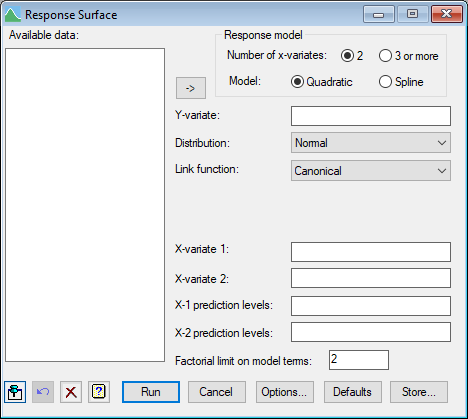
Number of x-variates
The number of x-variates to be fitted to the y-variate. If 2 variates are selected, these are put in the two fields X-variate 1 and X-variate 2, and the x-values that predictions are to be estimated at are entered in the X-1 prediction levels and X-2 prediction levels fields. If 3 or more variates are selected, these are put as a list in the X-variates field and the x-values that predictions are to be estimated at are entered in the X prediction levels field as a list also. The lists should have variates separated by spaces or commas. The 3 or more variates option is only available for the Quadratic model.
Model
The model to be fitted between the y-variate and the x-variates.
| Quadratic | A quadratic surface in the x-variates is fitted |
| Spline | A spline model using a set of basis functions specified in the options |
If a Spline model is selected, only the Normal distribution with the Identity link function can be used, and so these fields are not displayed.
Y-variate
Specify a response or y-variate containing the data for the height of the surface.
Distribution
List of available error distributions. If you select the Binomial distribution, then you must supply the Binomial totals in the space provided. Alternatively, if you select the Negative binomial distribution, you must supply the Aggregation in the space provided.
Link function
Lists the available link functions. If you select the Power link function then you must supply the Exponent in the space provided. Similarly, if you select the Logratio link function then you must supply the Logratio in the space provided.
Binomial totals
For a binomial distribution, this specifies a variate which contains the number of units the response was obtained from. This values in this must be greater than or equal to the corresponding values in the response variate.
X-variate 1
Specify the first x-variate to be fitted to the y-variate when there are just two x-variates.
X-variate 2
Specify the second x-variate to be fitted to the y-variate when there are just two x-variates.
X-variates
Specify a list of x-variates separated by commas or spaces when there are 3 or more x-variates. The variates must be separated by commas or spaces.
X-1 predictions
Specify the levels that the first x-variate will take when performing predictions when there are just two x-variates. When fitting a spline model this can also be a scalar or a single number giving the number of equi-spaced prediction values between the minimum and maximum x-value.
X-2 predictions
Specify the levels that the second x-variate will take when performing predictions when there are just two x-variates. When fitting a spline model this can also be a scalar or a single number giving the number of equi-spaced prediction values between the minimum and maximum x-value. The factorial combination of levels of the two sets of prediction levels for X1 and X2 will be produced.
X predictions
Specify a list of the predictions levels that the x-variates will take when performing predictions when there are 3 or more x-variates. The variates must be separated by commas or spaces. The factorial combination of levels of the sets of prediction levels for the x-variates will be produced.
Factorial limit on model terms
You can control the factorial limit on model terms to be generated for the Quadratic model. Setting this to 1 will remove interactions between the x-variates for a main effect only model.
Action buttons
| Run | Run the analysis |
| Cancel | Close the menu without further changes |
| Options | Opens a dialog where additional options for the Quadratic model or the options for the Spline model can be specified for the analysis |
| Defaults | Set the menu settings back to the default settings. Clicking the right mouse on this button produces a shortcut menu where you can choose to set the options using the currently stored defaults or the Genstat default settings |
| Store | Opens a dialog where you can save results from the analysis |
Action Icons
| Pin | Controls whether to keep the dialog open when you click Run. When the pin is down |
|
| Restore | Restore names into edit fields and default settings. | |
| Clear | Clear all fields and list boxes. | |
| Help | Open the Help topic for this dialog. |
See also
- Response Surface Quadratic Options
- Response Surface Spline Options
- Response Surface Quadratic Store Options
- Response Surface Spline Store Options
- Stats menu
- RQUADRATIC procedure in command mode
- VSURFACE procedure in command mode
- THINPLATE procedure in command mode
- TENSORSPLINE procedure in command mode