Select menu: View | QTL Data View
The QTL data view provides a display of all the data structures that are currently available within QTL data space in a docked pane on the left hand side of the interface.
- from the menu select View | QTL Data View.
OR
Stats | QTLs (Linkage/Assocation) | View QTL Data Space.

The view contains a tree list of all the different types of data folders. Each data structure is represented in the list with a different icon and the properties for each structure are displayed in tool tips (activated by moving the cursor over the structure name). There are four folders within the QTL data view which contain the data for different aspects of the QTL analysis. The folders are as follows:
| Phenotypic raw data | Displays the data structures for the phenotypic plot data. This data can be used in the Preliminary single environment REML analysis for estimating trait means. |
| Phenotypic means | Displays the data structures for the phenotypic means and associated information. This data can be used for the genotype by environment analysis and linkage analysis. |
| Genotypic data | Displays the data structures for the map data including marker scores, linkage groups and positions within linkage groups. This data can be used for the genotypic analysis such as calculating the genetic predictors. |
| Genetic predictors | Displays the data structures for the genetic predictors and associated information. The genetic predictor data is required for a linkage analysis. |
When data structure names have been stored in a QTL data space then when the QTL menus are opened the data structure names will automatically be entered into the relevant fields. Also only the data structures present within that data space will be displayed in the Available data, otherwise all the current data within Genstat will be displayed. When data are present within the QTL data space you can right-click on the Available data list to open a shortcut menu where you can change between displaying data only within the data space and all data within Genstat.
Right-click menu
There is a shortcut menu available for the view and can be activated by right-clicking on an area within the view. The items available on this menu are listed below:
| Create spreadsheet | If one or more data structures are selected in the view then they will be opened within a spreadsheet. |
| Add to data space | Opens a dialog where you can add data structures that are available in Genstat to the QTL data space. |
| Delete all | Lets you remove all the data from the QTL data space and optionally from the Genstat server. |
| Load data space | Opens a Genstat QTL data space from a file. |
| Save data space | Saves a Genstat QTL data space in a file. |
| QTL shortcut menu | Controls the display of the QTL shortcut menu. |
QTL data view toolbars
The QTL data view contains two toolbars. The first toolbar contains buttons providing shortcuts to opening files, adding data structures to the data space, saving the data space and help. This toolbar is always displayed.
![]()
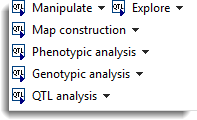
The second toolbar contains shortcuts to some of the QTL menu items.

This provides quick links to Data Manipulation, Data Exploration, Phenotypic Analysis, Genotypic Analysis and QTL Analysis menu items that are found under the Stats | QTLs (Linkage/Association) menu item. The QTL shortcut menu toolbar can be displayed or removed by right-clicking on the QTL data view and selecting the QTL shortcut menu item.
Add data to QTL data space from Genstat server
Usually data structures will be added to the QTL data space when data are imported or new structures are created through the QTL menus. An alternative way to add data to the QTL data space is to either select the Add to data space button ![]() on the QTL data view toolbar or right-click shortcut menu. This opens a dialog where you can add data structures that are available in Genstat to the QTL data space. The dialog has a different tab page for each of the four folders in the QTL data view.
on the QTL data view toolbar or right-click shortcut menu. This opens a dialog where you can add data structures that are available in Genstat to the QTL data space. The dialog has a different tab page for each of the four folders in the QTL data view.
| Phenotypic raw data |
| Phenotypic means |
| Genotypic data |
| Genetic predictors |
See also
- QTL data space for using data in QTL menus
- QTL analysis using menus
- Adding phenotypic plot data, phenotypic means, genotypic data or genetic predictor data to a QTL data space.