Use this to set the symbols and area colour for a 1D Density Plot.
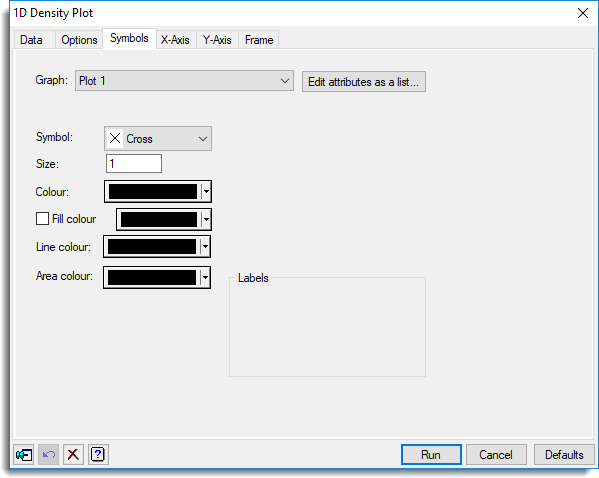
Graph
Lists the current plot for you to specify the line or symbol attributes. If groups have been specified on the data menu then these will be shown in the list for each graph. The groups are represented by the ordinal values and you can then set line/symbol attributes for each different level of the group.
Edit attributes as a list
This opens the Graphics Line and Symbol attributes dialog which allows the line and symbol attributes to be edited in a list, enabling easier access to multiple plots at once.
Symbol
Lets you specify a symbol that you can use to represent the points in the graph.
Size
Lets you specify an amount by which the standard size of the symbols are to be multiplied by. The value 1 represents the standard size used.
Colour
Lets you specify the colour of the symbols used on the graph.
Fill colour
If selected, this enables a list of colours from which you can fill the inner area of symbols. Select the colour you want to use to fill the area.
Line colour
Lets you specify the colour of the lines used to draw the smoothed density lines.
Area colour
Lets you specify the colour of the shaded area between the smoothed density lines when the Fill envelope option is selected in the Options.
Action buttons
| Run | Produce the graph. |
| Cancel | Close the dialog without further changes. |
| Defaults | Reset options to their default settings. |
Action Icons
| Pin | Controls whether to keep the dialog open when you click Run. When the pin is down |
|
| Restore | Restore names into edit fields and default settings. | |
| Clear | Clear all fields and list boxes. | |
| Help | Open the Help topic for this dialog. |
See also
- 1D Density Plot menu
- 1D Density Plot options tab menu
- DXDENSITY procedure