Use this to set attributes to control the appearance of the density plot.
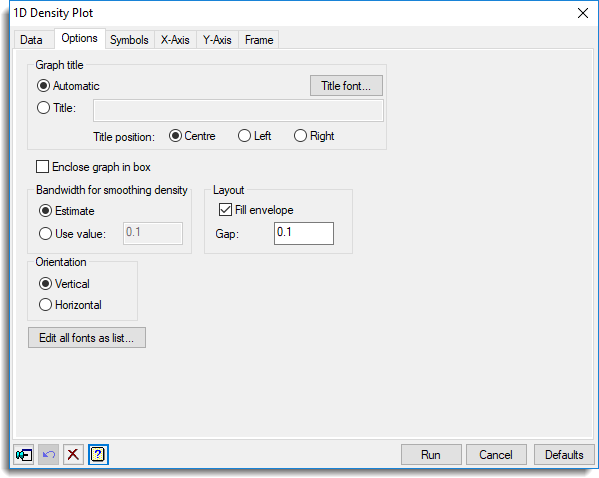
Graph title
IIf you select Automatic a title is generated for you using the names of the variate and groups. Select Title if you want to enter your own title. The title will be centred at the top of the graph.
Title position
You can position the title by selecting either the Centre, Left and Right options.
Title font
This opens the Edit Font dialog that lets you control the font for the title.
Enclose graph in box
Select this to draw an enclosing box around the graph.
Bandwidth for smoothing density
The bandwidth controls the amount of smoothing in forming the kernel density. If you select Estimate a value is estimated for the size of the dataset using the KERNELDENSITY procedure. If you select Use value you can specify a bandwidth in the field. A larger value will make the fitted kernel density smoother, and a smaller value will make it rougher. The value used must be greater than 0 and less than or equal to 1.
Fill envelope
If this is selected, the region between the two kernel density curves are shaded in the colour selected on the Symbols tab.
Jitter points
If this is selected, the points in the plot will have random variation added to their position around the central line. This is to avoid points overlapping, so that they can all be seen. The amount of jittering is controlled by the Use % of envelope field, which should give a value between 1 and 100. This specifies the percentage of the envelope width to use when jittering the points. As the jittering uses random numbers, the Seed for jittering controls those that are used. Using zero initializes the random number sequence from the computer’s clock, or continues an existing sequence. Specifying an nonzero value gives a repeatable graph.
Gap
This controls the size of the gap between envelopes for different variates or groups. A value of 0 will minimize the gaps between the envelopes while a value of 1 will maximise the gaps between them.
Orientation
Lets you specify the orientation of the plot. You can select either Horizontal or Vertical.
Display
Lets you specify extra “pirate-plot” style features to add to the plot.
| Means | Displays lines giving the mean value. |
| Medians | Displays lines giving the median value. |
| Percentiles | Display lines at the percentiles defined in the Percentiles field. |
| Confidence limits | Displays the confidence limits of the mean or median (depending on which is selected) with a shaded box. The size of the confidence region is controlled by the Probability level field. |
The Means and Medians are mutually exclusive. However, they can both be plotted if Means is selected and 50 is included the Percentiles. The Percentiles must be between 0 and 100, and can be entered as a space or comma separated list. The colour, line style and thickness for the lines that plot the features above are controlled by the associated Colour, Line style and Thickness. To change the colour of a feature, click the Colour box, and choose a new colour from the pop-up colour selector. The Line style items are in a drop-down list of the line styles available. The Thickness should be a value between 0 and 10. Additionally, the Fill and Transparency items control the colour used to fill the box for Confidence limits, and its transparency (between 0 for opaque and 255 for fully transparent).
Probability level
This controls the significance level of confidence region. This should be a value between 0 and 1.
Edit all fonts as a list
Clicking this opens the Edit All Fonts as a List dialog which allows all the fonts in the graph to be set in one place.
Action buttons
| Run | Produce the graph. |
| Cancel | Close the dialog without further changes. |
| Defaults | Reset options to their default settings. |
Action Icons
| Pin | Controls whether to keep the dialog open when you click Run. When the pin is down |
|
| Restore | Restore names into edit fields and default settings. | |
| Clear | Clear all fields and list boxes. | |
| Help | Open the Help topic for this dialog. |
See also
- 1D Density Plot – data menu
- Symbols tab menu
- Edit font dialog
- Text Sizes and Fonts options
- Edit All Fonts as a List
- Format labels dialog
- Graphics menus
- DXDENSITY procedure
- KERNELDENSITY procedure