Select menu: Stats | Regression Analysis | Nonlinear Models
The Nonlinear Models menu lets you fit a generalized nonlinear model. These are models that include some nonlinear parameters, but are otherwise in the form of generalized linear models.
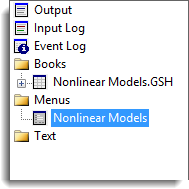
- After you have imported your data, from the menu select
Stats | Regression Analysis | Nonlinear Models. - Fill in the fields as required then click Run.
You can set additional Options then after running, you can save the results by clicking Save.
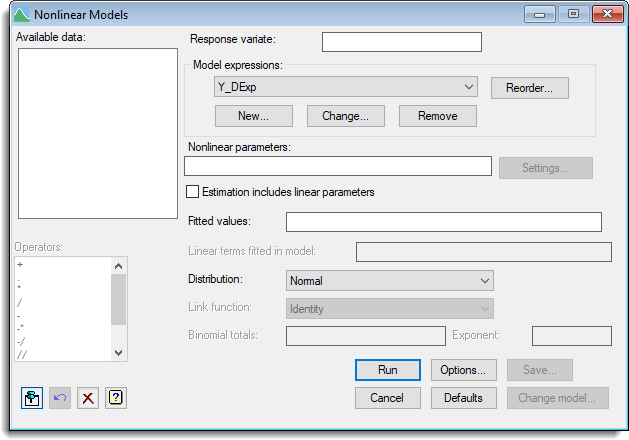
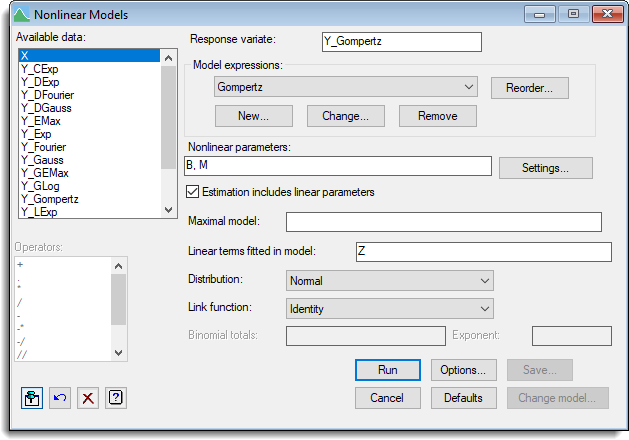
Available data
This lists data structures appropriate to the current input field. The contents will change as you move from one field to the next. Double-click on a name to copy it to the current input field or type the name.
Response variate
Specifies the name of the variate containing the response values.
Model expressions
Lists of the names of the expressions that contain the calculations involving the nonlinear parameters. You can add a new expression to the list by either double-clicking an expression name from the Available data list or by clicking the New button. You can edit or remove the currently selected expression by clicking on the Change or Remove buttons. You can change the order that the expressions are calculated by clicking the Reorder button.
Nonlinear parameters
Enter the names of the nonlinear parameters that are to be estimated. The names can be separated in the list by using either a space or ‘,’. You can specify the initial values, upper & lower bounds and step length for each parameter in the list by clicking the Settings button.
Estimation includes linear parameters
Specifies whether the estimation includes linear parameters. If selected, you can specify the maximal model, terms to be fitted and link function to be used. Otherwise, if there are no linear parameters then you must specify identifiers for the fitted values.
Fitted values
If the estimation does not include linear parameters in the model you can specify the identifiers to contain the fitted values for any set of values of the nonlinear parameters.
Maximal model
If the estimation includes linear parameters then you can specify the maximal model. This lets you specify the most complicated model that you are likely to want to consider. It may be left blank, but this may lead to subsequent inability to compare models because of data that are missing for some parameters but not for others; hence Change model is disabled in this case.
Linear terms for fitted model
If the estimation includes linear parameter then you can specify the linear terms which are to be fitted in the model.
Distribution
List of available error distributions. If you select the binomial distribution then you must supply the Binomial totals in the space provided. If you choose the negative binomial distribution, you must also specify a fixed value for the aggregation parameter (the parameter k in the formula for the variance in terms of the mean: v = m + m*m/k).
Link function
If the estimation includes linear parameters then you can select a link function from the available list. You can choose a general power link, in which case you need to specify the exponent; the logratio link, log(m / (m+k)), also requires you to specify the parameter k.
Binomial totals
For a binomial distribution, this specifies a variate which contains the number of units the response was obtained from. This values in this must be greater than or equal to the corresponding values in the response variate.
Examples
The Genstat spreadsheet file ‘Nonlinear Models.gsh‘ in the Genstat Examples directory. This contains a number of Y variates that depend on the variate X and follow various nonlinear models. To fit an Gompertz model Y = A + C*EXP(-EXP(-B*(X-M))) to the response variate Y_Gompertz the menu and options set up as described below. Note, this model could be more easily fitted via the Standard Curves but is used here for illustration for models that can not be fitted with this menu.
There are two ways of fitting this model, depending on whether the Estimation includes linear parameters is selected.
1. Estimation includes linear parameters selected
- Select File | Open then navigate to the default Windows installation folder C:\Program Files\Gen20Ed\Examples and select Nonlinear Models.gsh.
- From the menu select Stats | Regression Analysis | Nonlinear Models.
- In the Available data field double-click Y_Gompertz to move it into the Response variate field.
- Click New then enter the Reference identifier for expression as Gompertz.
- In the Expression field enter Z=EXP(-EXP(-B*(X-M))) to create a linear predictor and assign it to a variate, Z. Now click OK to close this dialog.
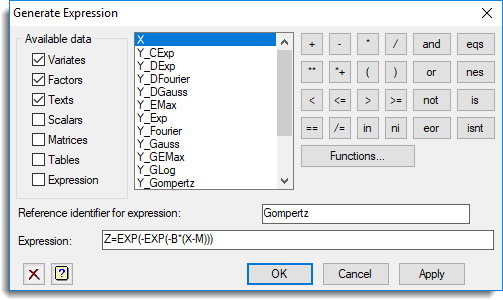
- Type our predictor Z into Linear terms fitted in model.
A linear parameter which is the multiplier for Z (i.e. C in the original equation) and a constant (i.e. A in the original equation) are estimated as linear parameters. This method is faster as only the parameters B and M are being estimated by the iterative optimization algorithm. - Type the nonlinear parameters B and M into the Nonlinear parameters field separated by a comma then click Settings.
- Select B then enter -3 for the Initial value. Select M then enter 2 for the Initial value.
It improves the chance of the optimization algorithm converging if good starting values are provided for the nonlinear parameters, and in this case values of -3 and 2 are used.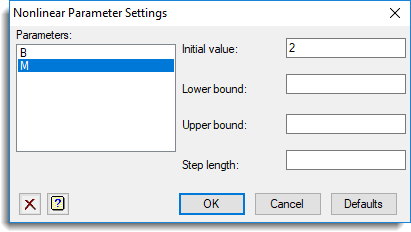
- Click Options and set options as shown below then click OK.
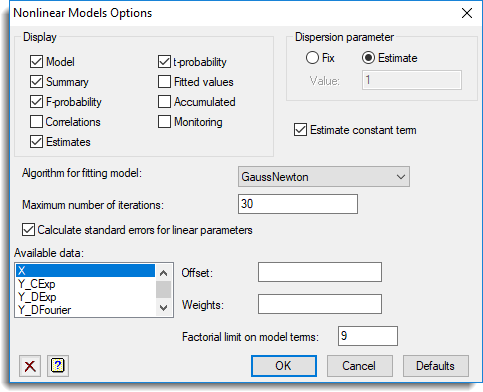
The completed dialog should look like this. You can now click Run and view the results in the Output.
2. Estimation includes linear parameters not selected
- Following on from the first example, bring the Nonlinear models dialog to the front by double-clicking it in the Window navigator. (You may need to click the Window tab at the bottom left of the screen to see this).
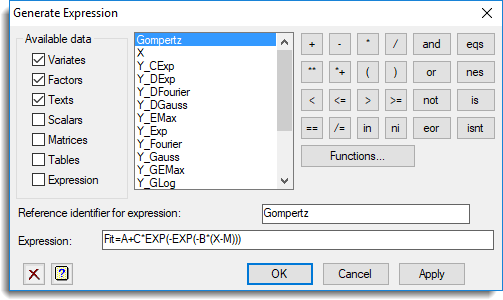
- Under the Model expressions field click Change.
- In the Expression field enter Fit=A+C*EXP(-EXP(-B*(X-M))). This assigns the model formula to the variate FIT. Now click OK to close this dialog.
- Deselect the checkbox Estimation includes linear parameters.
- Type our predictor FIT into the Fitted values field.
- Type the nonlinear parameters A, C, B and M into the Nonlinear parameters field separated by commas then click Settings.
- Select A then enter 6 for the Initial value.
Select C then enter -5 for the Initial value.
Select B then enter -3 for the Initial value.
Select C then enter 2 for the Initial value.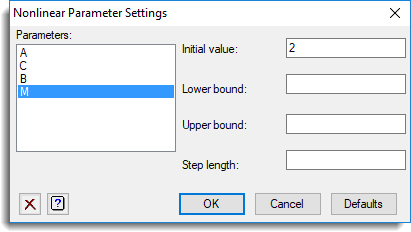
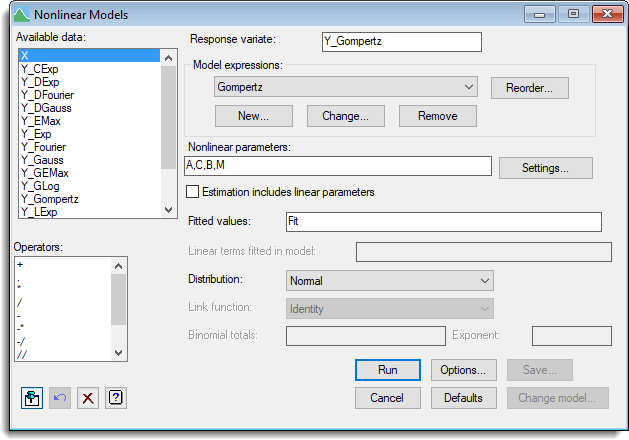
- Now click OK. The completed dialog should look like this (the Options are the same as in the first example. You can now click Run and view the results in the Output.
The completed dialog should look like this. You can now click Run and view the results in the Output.
See also
- Options
- Save Options
- Change Model
- Parameter Settings
- Generate Expression
- Reorder Expression List
- Nonlinear Quantile Regression menu
- Standard Curves for information on general options and other curves
- Standard Curves with Correlated Errors menu.
- Exponential Curves
- Fourier Curves
- Gaussian Curves
- Growth Curves
- Rational Curves
- Examples of Standard Nonlinear Curves
- FITCURVE directive
- FITNONLINEAR directive
- FIT directive
- RQNONLINEAR procedure
- MINIMIZE procedure
- SIMPLEX procedure