
Generates further output following a regression analysis.
Display
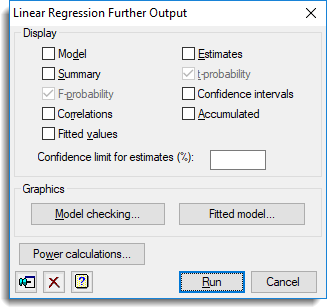
| Model | Details of the model that is fitted |
| Summary | Summary analysis-of-variance |
| F-probability | F probabilities for variance ratios |
| Correlations | Correlations between the parameter estimates |
| Fitted values | Table containing the values of the response variate, the fitted values, standardized residuals and leverages |
| Estimates | Estimates of the parameters in the model |
| t-probability | t probabilities for the parameter estimates |
| Confidence intervals | Confidence intervals for the parameter estimates. The confidence limit can specified as a percentage using the Confidence limit for estimates (%) field. |
| Accumulated | Analysis of variance table containing a line for each change in the fitted model |
| Wald tests | Wald and F tests for dropping terms from a regression |
Model checking
You can generate diagnostic plots for Model Checking.
Fitted model
You can draw a Graph of fitted model which shows the relationship of the response variate with one explanatory variate or one grouping factor or both. The fitted relationship is shown as one or more lines and the partial residuals are positioned with respect to the lines to represent the observed data.
Power calculations
You can calculate the power for a regression model.
Permutation test
Lets you perform random permutation tests for a regression model. Random permutation tests provide an alternative to using the F probabilities, printed for variance ratios in summary or accumulated analysis of variance tables, when the assumptions of the analysis are not satisfied.
See Also
- Linear regression options for choosing which results to display
- Linear regression further output for additional output subsequent to analysis
- Change Regression Model
- Saving Results for further analysis
- Save regression results in a spreadsheet
- Save Individual Regression Terms dialog
- Fitted Model for graphical display of the model
- Model Checking
- Simple Linear Regression
- Simple Linear Regression (with Groups)
- Multiple Linear Regression
- Multiple Linear Regression (with Groups)
- General Linear Regression
- Polynomial Regression
- Smoothing Spline
- Locally Weighted Regression
- Plot table of predictions
- Predictions from Simple Linear Regression
- Predictions from Simple Linear Regression (grouped)
- Predictions from Multiple Linear Regression
- Predictions from Multiple Linear Regression (grouped)
- Predictions from General Linear Regression
- Plotting Predictions
- Least Significant Intervals Plot Options dialog
- Change Regression Model
- Multiple Comparisons for Predictions options
- Quantile Regression menu
- Functional Linear Regression
- Generalized Linear Models menu
- Standard Curves menu for fitting standard non-linear curves