Use this to specify options when opening Affymetrix CEL files. This menu appears as each CEL file is opened. As CEL files can be very large (for example, 500,000 to 900,000 rows per file), it can be advantageous to process the data directly to the server, file by file, and save the results to a spreadsheet file. This menu provides some options to process the files in this way. In addition, you can reduce the memory overhead required by only reading the necessary columns from the CEL file. There are options to control how cells marked as outliers or masked are handled.
When data are loaded the Calculate Affymetrix Expression Values menu can be used to calculate expression values summarized over the PM/MM pairs or atoms. This mwnu provides more options than are available by just using the batch process which has only the summary method.
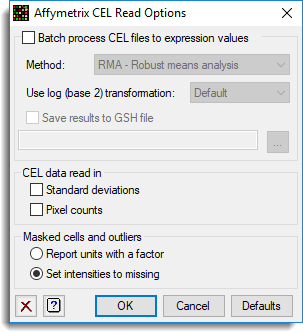
Batch process CEL files to expression values
When selected, the CEL files and associated CDF file will be loaded into the server, and a summary spreadsheet will be produced. This option is only available when CEL files are opened using the Open Microarray Data Files menu.
Method
The statistical method used to summarize over the PM/MM pairs. The methods available are:
| RMA – Robust means analysis model | The probe level model introduced by Irizarry et al. (2003) which only uses PM information and transforms the values based on a kernel density estimate of the PM distribution |
| RMA2- Robust means analysis 2 | An adaptation of RMA algorithm which fits the kernel density to a truncated distribution of the PM values, with the truncation point based on an initial kernel density estimate. |
| MAS4 – Affymetrix version 4 | The AvDiff algorithm introduced in the Affymetrix version 4 software |
| MAS5 – Affymetrix version 5 | The Tukey biweight algorithm introduced in the Affymetrix version 5 software |
In the Affymetrix MAS 4 and 5 methods the difference between the signals, PM – MM is averaged using a robust averaging. The MAS 4 algorithm uses the AvDiff algorithm which discards the minimum and maximum difference, and any differences greater than 3 standard deviations from the mean. The MAS 5 algorithm uses the Tukey biweight algorithm which reweights the differences depending on how far they are from the median, and discards any differences which are more than 5 times the median absolute distance from the median. The MAS 5 algorithm also replaces the MM value with a value which is always less than the PM value, calculating what is known as an Ideal mismatch (IM) in this situation.
The standard RMA algorithm would normally use the log 2 transformed PM values with no background correction, which then have a quantile normalization applied to them. The adjusted PM values then have a normal function transformation applied to them with the values for the transformation being calculated from a kernel density estimate applied to the adjusted PM values. Finally the transformed PM values are summarized with a median polish of the slides by atom values for each probe.
Use log base 2 transformation
This controls whether a to use a log base 2 transformation for the PM/MM intensities.
| Default | MAS5, RMA and RMA2 are transformed and MAS4 is not transformed |
| No | The PM/MM intensities are not transformed. |
| Yes | Log base 2 transformation is used for all the PM/MM intensities. |
The calculation for the transformation using Genstat command language is:
CALC LogY = LOG(Y)/LOG(2)
Save results to a GSH file
The results from the Batch process will be written to the specified .gsh file. You can click on the Browse button ![]() to locate a file and folder.
to locate a file and folder.
CEL data read in
When reading data from CEL files some columns can be excluded. These options control which columns can be excluded when the data is loaded.
| Standard deviations | The standard deviations of the pixel values used to calculate the intensity of each cell on the chip in the image analysis stage. |
| Pixel counts | The number of pixel values used to calculate the intensity of each cell on the chip in the image analysis stage. |
Masked cells and outliers
These two options control how the information on masked cells and outliers will be read in.
| Report units with a factor | A factor called Flags will be created. This will have 4 potential labels, None, Outlier, Masked and Both for a cell which is both an outlier and is masked. The original intensity value will be read in the Intensity column. |
| Set Intensity to missing | A missing value (*) will be inserted in the Intensity column wherever the cell is flagged as an outlier or as masked by the user. |
Action buttons
| OK | Read in the CEL files using the current options. |
| Cancel | Close the dialog and do not open the CEL files. |
| Reset | Reset options to the default settings. |
Action Icons
| Clear | Clear all fields and list boxes. | |
| Help | Open the Help topic for this dialog. |