You can set the properties of a column to change the way its values are displayed. Changes to column attributes only affect the current column, as indicated in the Column dropdown list at the top of the dialog. If a column is read only this will be displayed on the dialog. You cannot change column protection here – instead refer to Protecting/Unprotecting Columns.
- From the menu select Spread | Column | Attributes/Format.
OR
Double-click a column header.
- Select options as required then click Apply to apply your changes and keep the dialog open.
- To set properties for other columns, select another column from the Column field and repeat from step 2.
- Click OK when you’ve finished making changes.
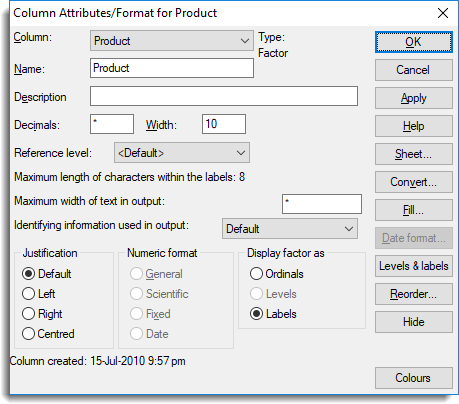
| Column | Select the column you want to format. |
| Name | Lets you change the name of the column. After editing the name click Apply to see your change immediately. |
| Descriptions | This sets additional text appended to the column name in the Output from some analyses. See Identifying information used in output further down this page. |
| Decimals | Specifies the number of decimal places for numeric columns in General, Scientific or Fixed format. The interpretation of decimals depends on the format chosen. For Fixed format it is the number of decimal places and for General and Scientific format it is the number of significant figures to be displayed. |
| Width |
Specifies the width of the column as the number of ‘average characters’. This will be an exact number of characters for fixed-width fonts, but only approximate for proportionally spaced fonts. (Note that you cannot change the font of an individual column or spreadsheet. The default spreadsheet font is set on the Tools | Spreadsheet Options Appearance tab.) |
| Reference level |
For a factor, a particular level is used as the base level in the parameterization of regression models. The effects of the other factor levels are then defined as differences from this base or reference level. This dropdown list of the factor’s current levels allows this to be set to a particular level. The option Default specifies the first level or the factor, and if the factor levels are reordered, the new first level will become the reference level. If a particular level has been chosen as a reference level, the spreadsheet will attempt to always make this the reference level on any operations that reorder the factor levels. |
| Display table headings as levels (tables only) | Show the levels of the factor indexing columns in a 2+ dimensional table, rather than labels. |
| Calculation (calculated columns only) | Specifies the formula used to calculate a column. This can be edited and then may be rerun using the Recalculate Spreadsheet Column dialog. This field is only displayed if the column has been calculated. |
| Minimum | number specifying the minimum value that the column will accept. If you try and enter a number smaller than this you will be prompted to correct it. You can still force the smaller number to be entered into the spreadsheet cell. A missing value (*) specifies no minimum value constraint. This field is not displayed for factor columns. |
| Maximum | A number specifying the maximum value that the column will accept. If you try and enter a number larger than this you will be prompted to correct it. You can still force the larger number to be entered into the spreadsheet cell. A missing value (*) specifies no maximum value constraint. This field is not displayed for factor columns. |
| Maximum length of characters within the labels | For a factor with labels, this displays the length of the longest label. This field is just for information and cannot be edited. |
| Maximum width of text in output | For a text or factor, this limits the width of the strings printed in the Output window to the specified value. This can be used to make printed tables or columns more succinct. |
| Identifying information used in output |
This controls the information that is used to identify data structures in the Output. For data structures that use a whole sheet (e.g. matrices or tables) this must be set on the first column of the spreadsheet containing the data (e.g. not classifying factors for a table or row labels for a matrix). This option has the same effect as using the the IPRINT setting for the data structures directives: VARIATE, TEXT, FACTOR, SCALAR, TABLE, MATRIX, SYMMETRICMATRIX and DIAGONALMATRIX.
|
| Data verified | An informational note to indicate data if this column has been verified through a double entry process. See Double-checking your Data Entries (data verification) for more details. |
| Justification | Specifies whether values should be right or left justified or centred. Default justification is left for text and right for numeric data. |
| Numeric format |
Specifies the format used for displaying numeric columns.
You can specify how numbers in date format are displayed by clicking the Date Format button. The default date format applied to a column is set by selecting Tools | Options then clicking the Date Format tab. |
| Display factor as | Controls how factors are displayed using ordinals, levels, or labels. Factor values are stored as ordinals which are integers in the range 1,2,…,n, where n is the number of levels of the factor. Factors are displayed using the ordinal values unless levels or labels have been defined. For a detailed description of levels and labels see Understanding Factors and Levels. |
| Colour using factor | This item is only displayed if one or more factor columns has colours associated with its levels. The dropdown list lets you change a column’s background cell colour using the colours associated with a factor column. The colours associated with a factor’s levels are set with the Edit Levels and Labels dialog. |
| OK | Apply your actions and close the dialog. |
| Apply | Apply your actions but leave the dialog open so that you can continue to make changes. |
| Cancel | Close the dialog without applying any changes. |
| Help | Open the context sensitive Help for this dialog. |
| Sheet | Open the Sheet Properties dialog where you can edit some of the spreadsheet properties. |
| Convert | Convert a column to a different type (variate, factor, text or units vector). You can use this same dialog to change the spreadsheet type (vector, matrix, symmetric matrix, diagonal matrix, table or scalar). |
| Fill | Generate a pattern or sequence of numbers to fill a column. |
| Date format | Change the date format and base date used to display a column’s values when the numeric format type Date is selected. |
| Levels & labels | Open the Edit Levels and Labels dialog where you can edit the factor’s levels, labels and colours all in one place. |
| Reorder | Change the order that the factor levels/labels are displayed. |
| Hide/Show | Click to Hide the currently select column (this changes the button to Show). |
| Recalculate | Recalculate the column (if it has a column calculation). |
| Colours | Lets you change the column’s text and background colours. |