Select the output to be generated initially in a regression analysis – the same information can also be displayed after the analysis, using the Further output dialog. You can also request that no constant term is included in the model: this will affect only the parameterization of factor effects, if there are factors in the model; but if not, it will constrain the regression to pass through the origin.
For a general regression model, you can also control the maximum order of interaction to be generated when you use model-formula operators like *. The default is to include all interactions, up to those involving nine variates or factors. (You cannot ask for more than nine.)
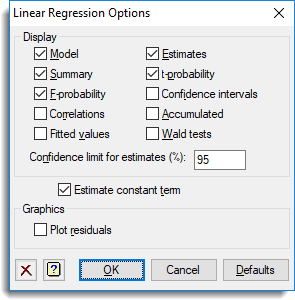
Display
| Model | Details of the model that is fitted. |
| Summary | Summary analysis-of-variance. |
| F-probability | F probabilities for variance ratios. |
| Correlations | Correlations between the parameter estimates |
| Fitted values | Table containing the values of the response variate, the fitted values and residuals from the regression. |
| Estimates | Estimates of the parameters in the model |
| t-probability | t probabilities for the parameter estimates the fitted values, standardized residuals and leverages. |
| Confidence intervals | Confidence intervals for the parameter estimates. The confidence limit can specified as a percentage using the Confidence limit for estimates (%) field. |
| Accumulated | Analysis of variance table containing a line for each change in the fitted model. |
| Wald tests | Wald and F tests for dropping terms from a regression. Where the regression contains a model function (e.g. polynomial, smoothing spline or locally weighted (loess) terms), the Wald tests cannot be calculated. |
Estimate constant term
Specifies whether to include a constant in the regression model. In simple linear regression this omits the intercept, in other words the fitted line is constrained to pass through the origin.
Graphics
Lets you generate default plots when you run a regression analysis. Plot residuals will produce diagnostic plots of the residuals. Following simple linear regression you can also use Plot fitted model to generate a graph of the fitted model.
See Also
- Further Output
- Change Regression Model
- Saving Results
- Save Individual Regression Terms dialog
- Save regression results in a spreadsheet
- Fitted Model for graphical display of the model
- Model checking
- Predictions from Simple Linear Regression
- Predictions from Simple Linear Regression (grouped)
- Predictions from Multiple Linear Regression
- Predictions from Multiple Linear Regression (grouped)
- Predictions from General Linear Regression
- Plot Table of Predictions
- Least Significant Intervals Plot Options dialog
- Change Regression Model
- Multiple Comparisons for Predictions options
- Linear Regression for information on general options and other models
- Simple Linear Regression
- Simple Linear Regression (with Groups)
- Multiple Linear Regression
- Multiple Linear Regression (with Groups)
- General Linear Regression
- Polynomial Regression
- Smoothing Spline
- Locally Weighted Regression
- Quantile Regression menu
- Functional Linear Regression menu
- Generalized Linear Models menu
- Standard Curves menu