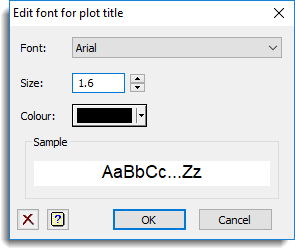
Use this to set fonts to control the appearance of the text in a graph. The items for which fonts can be set depend on the type of graph, for example, only if it is a 3D graph will the Z-axis title and labels will be able to be set (by clicking the Label font button). To edit the font for a graph title click the Title font button on the Options tab. You can set the Font, Size and Colour.
The default font and sizes for these are controlled by the current graphics environment which can be set in the Graphics Environment menu.
Font
This is a drop-down list that gives a selection of the fonts available on your computer. Select the font that you want the text to be displayed in.
Size
This numeric value that gives the size of the font as a multiplier of the standard Genstat font height. This must a positive number. The spin button after the size field will decrease or increase the font size by 0.1.
Colour
This gives the colour of the font. Clicking the button will open a box enabling one of the 32 standard colours to be selected, or else a custom colour to be selected with the Windows colour picker.
Sample
This displays a preview of your selected font with the size and colour attributes you selected.
Font items
The items that can have their fonts edited with this dialog are:
Overall title
This controls the title at the top of panel plots like Trellis Plot and Scatter Plot Matrix. The titles for each individual plot within the array of plots is controlled by the Plot title item.
(Plot) Title
This controls the title for an individual plot. The position of the title can be controlled in the Frame options tab. The default settings for this are set in the Graphics Environment Frame tab.
(X/Y/Z) Axis title
This controls the title of the specified axis (X-axis, Y-axis or Z-axis). Where these cannot be set individually (for example in a dot-histogram), there is no axis label (X/Y/Z), and the settings applies to both axes of the plot. The default settings for this are set in the Graphics Environment Axis tab.
(X/Y/Z) Axis labels
This controls the labels of the specified axis (X-axis, Y-axis or Z-axis). Where these cannot be set individually (for example in a dot-histogram), there is no axis label (X/Y/Z), and the settings applies to both axes of the plot. The default settings for this are set in the Graphics Environment Axis tab.
Action buttons
| Run | Produce the graph. |
| Cancel | Close the dialog without further changes. |
See also
- Edit All Fonts as a List window
- Graphics Environment menu
- Graphics tab of Tools | Options where the default font can be set
- Axis options
- Line and Symbols options
- Key tab menu
- Frame options
- DFONT, PEN and DHELP directives