This menu produces diagnostic plots useful for checking the assumptions needed to interpret the analysis of regression models.
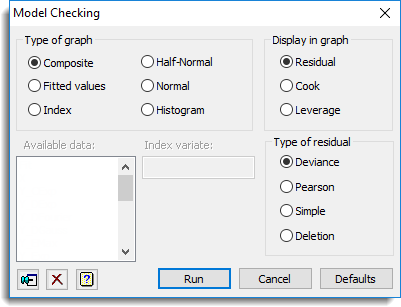
Type of graph
Specify how the chosen statistics are plotted: against the fitted values, or an index variate (the only index currently available is the unit numbers of the observations), or as Normal or Half-Normal plots, or as a Histogram. The default is a composite diagram, including a plot against the fitted values, Normal and Half-Normal plots, and a Histogram.
Display in graph
Select the quantity to be plotted: Residuals, Cook’s statistics or Leverages. Leverages measure the influence of each unit on the fitted model, and Cook’s statistics combine the size of a residual together with the influence. Only Residuals can be selected after fitting curves.
Type of residual
When plotting residuals, you can select Deviance or Pearson residuals, both of which are standardized, or studentized, by dividing by their standard errors. (These two types of residual are the same for linear models, but not for generalized linear models.) Alternatively, you can choose Deletion residuals or Simple (not standardized) residuals.
See also
- Further Output
- Options for choosing which results to display
- Change Regression Model
- Saving Results
- Save regression results in a spreadsheet
- Linear Regression for information on general options and other models
- Simple Linear Regression
- Simple Linear Regression (with Groups)
- Multiple Linear Regression
- Multiple Linear Regression (with Groups)
- General Linear Regression
- Polynomial Regression
- Smoothing Spline
- Locally Weighted Regression
- Quantile Regression menu
- Functional Linear Regression menu
- Generalized Linear Models
- Standard Curves