This lets you change the colour palette used to distinguish between groups in the plot. There are 11 standard palettes and 4 user colour palettes. You can change the user colour palettes using the Define User Palette dialog to your make own selection of colours which are kept between sessions.
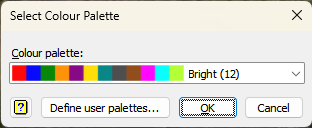
Colour palette
This gives a drop down list of the 11 standard palettes and 4 user colour palettes. Select the colour palette you wish to use.
Define user palettes
Edit a user colour palettes using the Define User Palette dialog.
Action buttons
| OK | Close the dialog, and use the specified palette. |
| Cancel | Close the dialog without any changes. |
See also
- Graphics Line and Symbol attributes dialog
- Define User Palette dialog
- 2D Scatter Plot
- 2D Line Plot
- 3D Scatter Plot
- 1D Density Plot
- Scatter Plot Matrix
- Polar Plot
- Spiderweb or Star Plot
- Confidence Region Plot
- Key tab menu
- Apply to All Plots dialog
- Insert Symbols
- Add Text to Graph
- Add Reference Line to Graph
- Graphics Menu
- DSCOLOURS procedure