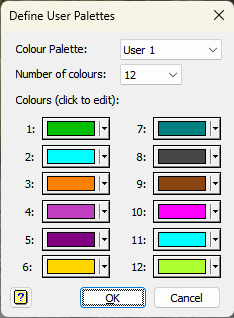
This lets you change the colours assigned to the 4 user colour palettes. Select the colour palette to edit and click the colour buttons to change any of the 3-12 colours in each palette. The user palettes are stored in the registry and so are maintained between sessions.

Colour palette
The user palette (User 1-4) to be edited.
Number of colours
A drop down list of the number of colours (3-12) to be assigned to the user palette.
Action buttons
| OK | Close the dialog, and update the specified palette. |
| Cancel | Close the dialog without any changes. |
See also
- Select Colour Palette dialog
- Graphics Colours
- Graphics Line and Symbol attributes dialog
- 2D Scatter Plot
- 2D Line Plot
- 3D Scatter Plot
- 1D Density Plot
- Scatter Plot Matrix
- Polar Plot
- Spiderweb or Star Plot
- Confidence Region Plot
- Key tab menu
- Apply to All Plots dialog
- Insert Symbols
- Add Text to Graph
- Add Reference Line to Graph
- Graphics Menu
- Graphics Colours
- PRINT directive on more about symbols and text formatting