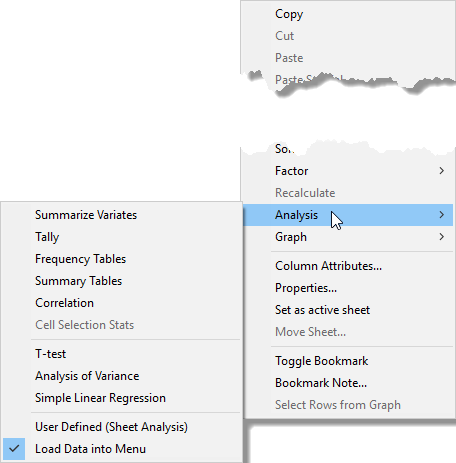
Within the spreadsheet right-click shortcut menu there are two submenus: Analysis and Graph. These contain shortcuts to some of the more commonly used statistical and graphical menus.
The names of the columns in the spreadsheet are passed to these menus and if there is a selection of columns then they are submitted in the order they were selected. There is an option in the Tools | Spreadsheet Options | General dialog entitled Open menus with selected data that can be used to control how the statistical or graphics menus are used. When this is selected the corresponding statistical or graphics menu is opened with the selected columns entered into the appropriate fields. Otherwise the analysis or graph is run automatically. If there are not enough columns selected for the analysis or graph to run automatically, the appropriate menu will be opened with partial information entered. Note that the ANOVA, t-test and regression menus are always opened with the selected data.
Statistics
The quick analysis statistics menu commands.
Summarize Variates
This links to the Summary Statistics menu. Any selected variate column will be summarized, or, if no columns are selected, the current column will be used. The last selected factor column is used to do the analysis by groups.
Tally
This links to the Tally Table menu. Any selected columns will have counts of distinct items displayed, or, if no columns are selected, the current column will be used.
Frequency Tables
This links to the Frequency Tables menu. Any selected factor column will have counts calculated, or, if no columns are selected, the current factor column will be used. A cross tabulation will be performed when multiple factor columns are selected.
Summary Tables
This links to the Summary Tables menu. Any selected variate column will have means calculated, or the current column if none is selected. Any selected factor columns will be used to form the groups, or the current factor column if there are no selected factors.
Correlation
This links to the Correlations menu. All selected variate columns will be used in the correlation matrix.
Cell Selection Stats
Summary statistics for the selected cells will be calculated. These include the arrangement of cells (selection types, and number of rows by columns), the number of numerical observations, missing values and text cells, and for the numerical cells, the total, mean, minimum, maximum, variance, standard deviation, standard error of the mean and the % coefficient of variation.
T-test
This links to the t-tests menu. The last selected variate will be used as the variate of responses, or the current variate column if no variate has been selected. If a factor is selected, this forms the groups for the T-test.
Analysis of Variance
This links to the Analysis of Variance dialog. The last selected variate column, or the current column if it is a variate and no variate columns are selected is the Y variate. Any selected factor columns are used as a full factorial treatment structure. If no factors are selected, and the current column is a factor then this is used for a one-way ANOVA.
Simple Linear Regression
This links to the Simple Linear Regression menu, unless a group factor has been selected, in which case it opens the Simple Linear Regression with groups menu. The last selected variate column is the Y variate. The second to last selected variate column is the X variate. The last selected factor column is the groups factor.
User Defined (Sheet Analysis)
This links to the Analyse Spreadsheet Columns dialog. This allows a set of any Genstat directives to be run on the selected set of columns, or the current column if there are no selected columns.
Load Data into Menu
Controls how the graphics and analysis menu items operate. When selected, any graphic or statistical menu will be opened with the currently selected columns will be automatically entered into the appropriate fields, otherwise commands will be automatically run without the menu being displayed.
Graph
The quick analysis graphics menu commands.
2D Scatter Plot
This links to the 2D Scatter Plot dialog to produce a scatter plot. The last selected variate column is the Y variate. The second last selected variate column is the X variate. The last selected factor column is the groups factor.
2D Line Plot
This links to the Line Plot dialog for a line plot.
3D Scatter Plot
This links to the 3D Scatter Plot dialog for a 3 dimensional scatter plot. The last selected variate column is the Z variate. The second last selected variate column is the Y variate. The third last selected variate column is the X variate.
Histogram
This links to the Histogram dialog for a histogram. The last selected variate column is the Y variate. The last selected factor column is the groups factor.
Boxplot
This links to the Boxplot dialog for a boxplot. The last selected variate column is the Y variate. The last selected factor column is the groups factor.
Bar Chart
This links to the Bar Chart dialog for a bar chart. The selected columns are used to create a table of means if any variate columns have been selected, otherwise a table of frequencies of the groups selected. Any selected variate column will have means calculated, or the current variate column if none is selected. Any selected factor columns will be used to form the groups, or the current factor column if there are no selected factors.
Scatter Plot Matrix
This links to the Scatter Plot Matrix dialog for a scatter plot matrix. Any selected variate columns are used in the scatter plot matrix. The last selected factor column is the groups factor.
Image Plot
This links to the Image Plot dialog for plotting image data. This is available for when you have variate columns containing the RGB values, and the column and row coordinates. The data can also be supplied in a matrix of RGB values.
Contour Plot
This links to the Contour Plot dialog for a contour plot. This item is only available when the data are in a matrix.
Surface Plot
This links to the Surface Plot dialog for a surface plot. This item is only available when the data are in a matrix.
Shade Plot
This links to the Shade Plot dialog for a shade plot. This item is only available when the data are in a matrix.
See also
- Analyse spreadsheet columns
- Spreadsheet options – General tab
- Graph selector