This Trials system is a menu based system that can be used for a variety testing pipeline. It creates special spreadsheets (Trial files *.trl) that contain meta-data to provide automatic summaries across seasons and calculation of columns from other columns, as well as meta-analysis across multiple trials with the same measurements and some common entries.

The Trials menu must be enabled in the Menus tab of Tools | Options menu, by ticking the Include Trials menu option.
Creating a New Trial
Use the Trials | Open | Create New Trial menu. Note: there is the requirement that the number of plots (number of rows multiplied by the number of columns) must equal the number of treatments multiplied by the number of replicates. You can add extra dummy treatments (a control or a duplicate entry) to fit a layout. After generating the trial, you can combined the duplicated entries into one group.
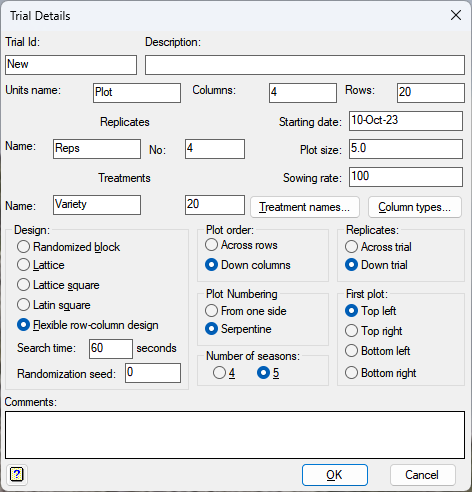
Click Treatment names to provide treatment labels. You can cut and paste these from Excel.

The spreadsheet is created. Design columns are locked (protected, or read-only) for safety.
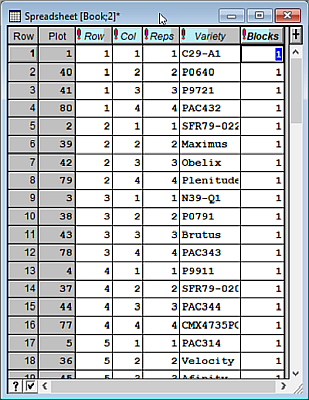
If you need to change these, right-click the column and choose the Protect column item (which will be ticked).

Selecting this again, after the column has been edited will re-protect the column.
The Trials | Edit | Column Types menu allows you to set up column types and automatic calculations. You can also select this when creating the Trial, with the Columns Types button.

A column with Totals or Means ticked can be filled with seasonal totals or means.
The calculations are in the form of a formula with &k as a placeholder for column type k, k = 1…n. E.g. DM_Yield = &3 * &5/&4 will give the calculation Fresh Weight * Dry Sample/Wet Sample.
There are settings for Grass, Brassica, Clover, Maize, Fodder Beet and User. To use these, drop down the list next to Set defaults to and select the item types you want, then click the Set defaults to button. To use the User entry, set up the columns and then click the Save as user button. Then next time you create a trial you can use the User item for the options that you saved.
Adding columns to the trial
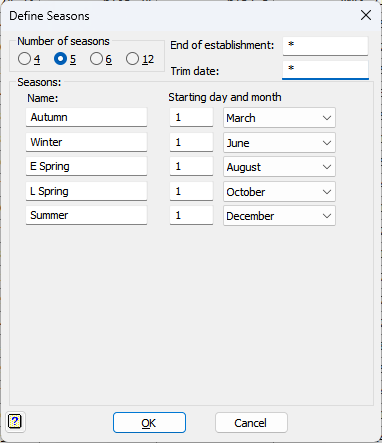
The Trials | Edit | Seasons controls the dates used in calculating establishment and seasonal totals, with a potential trim cut included (a zero cut on that date).
The Trials | Edit | Trial Information allows the initially-entered trial setup data to be modified (e.g. changing the trial start date when it was actually sown).
This gives the same dialog as the Trials | Open | Create New Trial, but when clicking Ok the trials attributes are updated, instead of a design being generated.
The Trial | Add | Column allows a new measurement to be added. Set the Date, and the Description will be modified to match the date.

Cut numbers should be sequential for that column type. However, you can insert a cut between two existing cuts by defining a date for the cut that falls within the current sequence. You will then be prompted to update the cut numbers. An empty column is created when you click Ok. Data can then be entered or cut and pasted into the column.
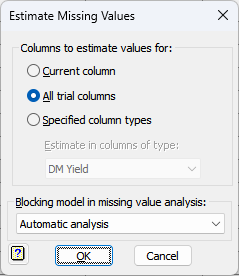
If a column has missing values, these should be estimated using the Trials | Edit | Estimate Missing value menu. They will be estimated for the columns that you have selected. This will not work if more than half the columns values are missing. A comment with a light purple bookmark will be added to each cell with an estimated missing value.

Note if a plot has stopped yielding, its measurements should be set to zero rather than a missing value.
Creating seasonal summaries
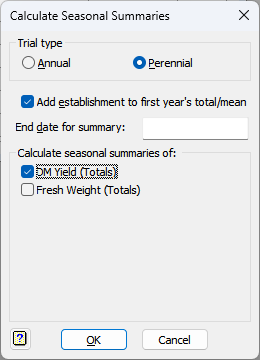
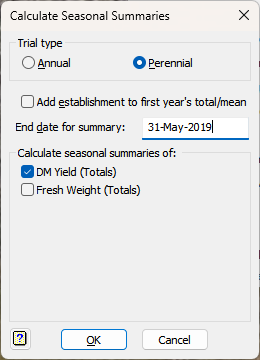
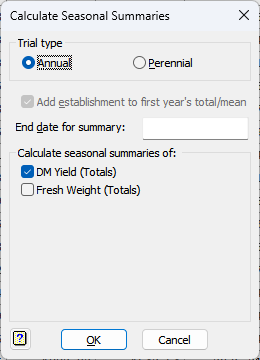
The Trials | Add | Seasonal summaries menu calculates seasonal summaries for column types with totals or means selected. The calculated columns are added to the end of the spreadsheet. If they already exist they are replaced with the new versions. You need to select the type of trial (Annual or Perennial) for the summary.
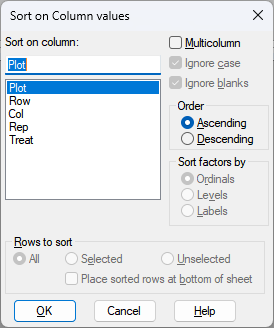
The Trials | Sort menus allow the rows to be sorted into specific orders.
The Trials | Output menus allow trial information to be output in a number of formats, to either an Excel file, the Graphics viewer or the Output window.
Analysing the trial
The Trials | Analyse | Trial allows any columns from a single trial to be analysed. If a set of columns is selected, only these columns are analysed. The default Blocking terms of Automatic analysis fits the best spatial model if needed, otherwise it drops back to a randomized-block analysis. Selecting a set of Treatments expresses the relative means as a percentage of the average of these treatments, otherwise the Relative means uses the trial mean (average of all treatments).
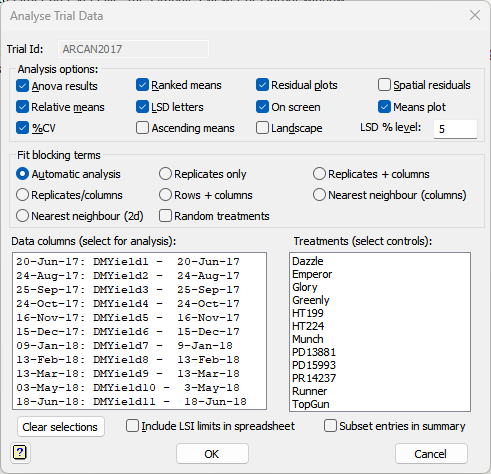
Ticking Subset entries in summary allows just selected treatments to be presented in the summary spreadsheets and graphs. Select entries and click Include or Exclude or double click an entry to change its In/Out status.
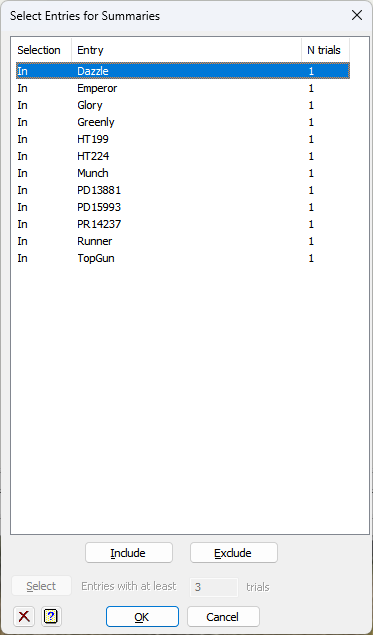
The Select button can be used when you are in the dialog with the multi-trial analysis. The seasonal summaries can be created or updated at any time, as above.
Analysing a series of trials
The Trials | Analyse | Multiple Trials together allows you to combine treatment estimates across more than 2 or more trials.

Select the trial files to summarize by using the Browse … button and selecting the trial files.

Click Open and a spreadsheet is created showing the presence of the columns in each trial.

Click Ok to continue with the analysis, or Cancel if you need to modify the column names to match across trials.
The same options are available here as in the single trial analysis.

The Trials | Analyse | Seasonal Summaries menu produces spreadsheets, graphs and output of the analysis of all seasonal summaries in the trial file in a standard format. A reduced set of options is available for this analysis. The type of summary will depend upon whether the summaries were created for a Annual or Perennial trial. You can include part years by selecting this option.

This file has been already saved to Excel and Word in the current working directory.
Converting an Excel file to a trial file.
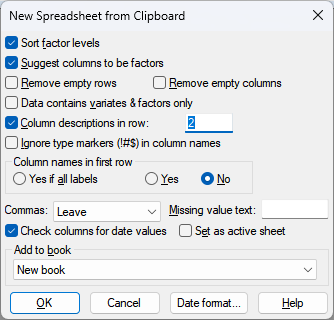
The Excel file needs to have a heading row with unique identifiers and a second row containing dates in Excel date format. A plot number (Plot#) and the following factors are required: Rep!, Row!, Col!, Variety!. These must be consistent in trials that are to be combined. These columns do not require dates. Put an exclamation mark on any factors columns. The column names must also match between sheets if they are to be combined. Missing plots should be empty cells. If you use another missing value code (-, M or missing), the column will be read as a text column. However, you can convert it to a variate inside Genstat (on the right-click menu � click Ignore, No and Ok). Select all the data in Excel and copy to the clipboard with Ctrl+C. In Genstat create a spreadsheet from the clipboard with Alt+F2 (Spread | New | from Clipboard). Set the option for column descriptions in row 2.
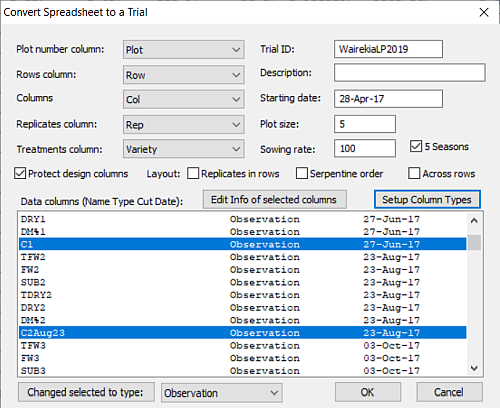
Convert any columns that have been read as text to variates. Then use the Trials | Open | Convert Sheet to Trial menu.
Creating row and column information from a trial plan.
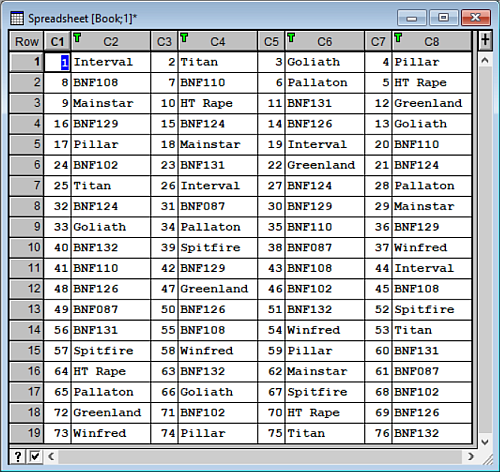
If you do not have a column indexing the rows and columns in the trial, but have a trial plan in Excel, you can create this information from the trial plan. Select the trial plan in Excel and copy it to the clipboard. In Genstat use the Alt+F2 shortcut and set the column names to none.

Click Ok to obtain the spreadsheet.
Insert a column Row if not already there using the Spread | Insert | Column menu.

Give it the name Row and tick the Fill column option and click OK twice.


Now stack the columns to get a list of plots with row and column numbers using the Spread | Manipulate | Stack menu.

The stacked spreadsheet is shown below.
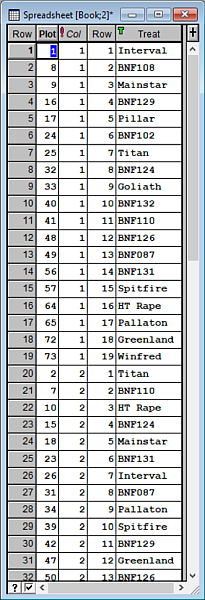
Then sort the data into plot order (Ctrl+F9)
The sorted spreadsheet is shown below.

You can then cut and paste the Row and Col columns into the source Excel file.
Example of an Perennial Trial
The file PRCANT2016.trl contains the 3 years of a perennial trial. There are some missing values which will need to be estimated before the seasonal summaries are created. Open this file from the File | Open Example Data Sets menu. Use the Trials | Edit | Estimate Missing values menu for the DMYield columns.
Use the Trials | Add | Seasonal Summaries to create these.
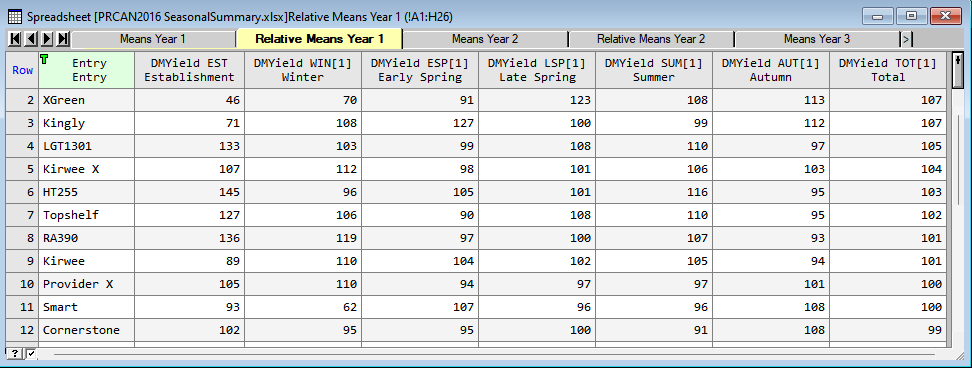
Use the Trials | Analyse | Seasonal Summaries to create the summary for these.
The summary will pop up in a spreadsheet:
Summary of an Annual Trial
Open the file ARCAN2016.trl from the File | Open Example Data Sets menu. If you use the Trials Edit | Estimate Missing Values menu you will get a note saying there are none.
Use the Trials | Add | Seasonal Summaries to create these. Select the Annual trial type.
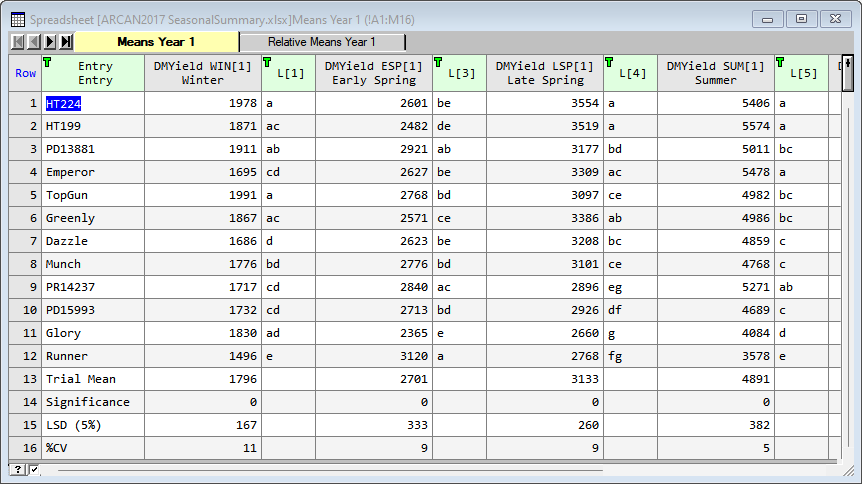
Use the Trials | Analyse | Seasonal Summaries to create the summary for these, as before.
The summary will pop up in a spreadsheet. Note Autumn is the first season. The first autumn is actually the establishment period.

Example of a Combined Analysis of Trials
Open the Trials | Analyse | Multiple Trials together menu. Click on the Browse … button to select the trials to combine. This example uses the four PR*.trl files in the Genstat data folder.

A spreadsheet showing which columns are in which trials will appear, with an option to proceed (OK) or stop (Cancel).
If the columns do not match up across the trials you will need to rename these to match across the various trials. Note the column name matching is case sensitive. To rename the columns to align measurements between trials use the Spread | Column | Rename menu.

The analysis dialog then has the same options as the individual trial analysis dialog select the measurements you want to analyses across the trials.